

 Português pt
 Español es
 العربية ar
 বাংলা bn
 Deutsch de
 Filipino fil
 Français fr
 हिन्दी hi
 Bahasa Indonesia id
 Italiano it
 Русский ru
 Svenska sv
 ไทย th
 Türkçe tr
 Tiếng Việt vi
 简体中文 zh
Updated:
MarketsDoes the World Cup Affect Trading? What the 2026 Data Shows
 Rafael AzevedoEditorial character · Markets Desk

Quick answer
The World Cup affects the market mainly through indirect paths: less investor attention during matches, lower volume, and worse execution in the local market. At the 2026 World Cup, the Ibovespa's average volume fell 15.3% compared with the six prior weeks, while the S&P 500's stayed about the same. The tournament isn't a buy or sell signal.
The financial market doesn't trade soccer match results. It trades expectations. Still, every World Cup brings the same question: does it move currencies, stocks, and indices? The paths exist, but they're almost always indirect: investor attention, liquidity, mood, exposure of specific companies, and spending on tourism and advertising.
Since the 2026 World Cup was played in the United States, Canada, and Mexico between June 11 and July 19, we can look at the numbers instead of staying in theory. We compared the Ibovespa and the S&P 500 in the six weeks before, during, and in the six weeks after the tournament, using daily data from Yahoo Finance.
What changes in the market during a World Cup
The most studied effect isn't a goal moving the price, but the public stopping paying attention to the market. Academic research using 2010 World Cup data found a drop in exchange trading activity during national team matches. Fewer people watching the screen tends to mean thinner volume, wider spreads on some assets, and slower reaction to news.
The other paths depend on something concrete happening: hotels, airlines, and payment providers can sell more in host cities, and a sponsor gains visibility. That only becomes a price factor when it shows up in quarterly results or in an analyst's forecast revision.

How we measured the effect: what we compared
We split three session windows: April 29 to June 10 (before), June 11 to July 19 (during), and July 20 to August 31 (after). For each one, we calculated three numbers from the daily bars:
- Average daily volume reported by the source for the index.
- Average daily move, in absolute terms: how much the index moved, up or down, from one close to the next.
- Cumulative move of the index over the window.
Real example: Ibovespa and S&P 500 at the 2026 World Cup
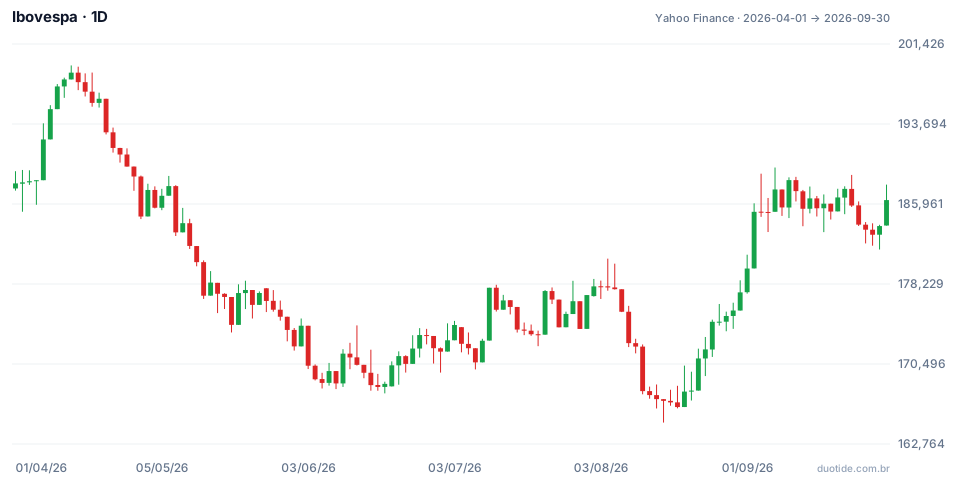
The chart shows the Ibovespa from April to September 2026. The World Cup covers the stretch from mid-June to mid-July, right after a sharp drop.
Ibovespa: lower volume during the tournament
The Ibovespa's average daily volume was 15.3% lower during the World Cup than in the six prior weeks and 8.8% lower than in the six weeks that followed. The average daily move also fell: 0.94% before, 0.72% during, and 0.75% after. That's consistent with the idea of less attention, but it doesn't prove causation, as the next item shows.
Context weighs more than soccer
Before the World Cup, the Ibovespa had been dropping 10.60%: it closed April 28 at 188,619 points and June 10 at 168,619. During the tournament it rose 3.02%, to 173,714 points on July 17. The period's low didn't come during the World Cup, but afterward, on August 14, at 164,835 points. A market that just dropped 10% naturally tends to change pace; separating that from a World Cup effect using daily data isn't possible.
S&P 500: almost no difference in the host country
In the United States, which hosted most of the matches, the S&P 500's average daily volume during the World Cup was practically the same as in the six prior weeks (0.2% higher). The average daily move was 0.61% before, 0.67% during, and 0.55% after, and the index rose 2.62% during the tournament's window. The more visible drop in volume came afterward, in August, a traditionally weaker month in the northern hemisphere.

How to use this information
In short-term trades
The most useful practical effect is operational. If your country's national team plays during the session, expect worse execution in the local market: choppier candles, moves that don't hold, and less friendly spreads. That's a reason to reduce size or avoid that time window, not a buy or sell signal.
In stocks tied to the event
Tourism, aviation, beverages, sporting goods, and media gain attention. Before treating that as a thesis, look for the path to the price: bookings above expectations, a company comment in its earnings, an analyst forecast revision. Without that, the headline is just context.
In the host country's index
The S&P 500 data in 2026 shows that a large, global market rarely changes behavior because of a tournament, even as the host. Rates, inflation, employment, and company earnings remain the main drivers.
Limitations
The numbers above use daily bars, which don't show what happens during each match's exact hours; the attention effect is intraday. The windows also include holidays and news that have nothing to do with soccer. A single World Cup is a small sample: it's useful for illustration, not for building a rule.
Common mistakes when linking the World Cup to the market
- Creating simple rules like “the champion country's market rises” or “the sponsor's stock rises.”
- Attributing to the World Cup a move that has a macroeconomic explanation, like rates or company results.
- Forgetting that local liquidity drops during matches and trading with the same position size.
- Drawing conclusions from a single tournament, or from daily data, about an effect that happens in a matter of hours.
- Treating a sports headline as an investment thesis without confirmation in the numbers.
If you want to observe the effect yourself, use a demo account during the next major sporting event: note the match times, compare the 5- or 15-minute chart's behavior during those hours with normal days, and log what you saw. Your own data is worth more than any guess.
Practice before you risk. Open your Duotide account and test your ideas on the demo account with US$10,000 in virtual funds.
Create free accountUpdated:
Editorial character of the Duotide newsroom. Articles are written by the team with the help of artificial intelligence; prices and charts come from real market data. Follows the news that moves prices — rates, stock markets, companies and commodities — explained without jargon.
Was this article helpful?
Be the first to rate it.
Comments
- No comments yet. Be the first to comment.
Ready to put it into practice?
Open your account and practice on the demo account with US$10,000 in virtual funds, without risking money.
- Secure platformProtected login and identity verification
- Multilingual supportHelp available every day
- Free demo accountUS$10,000 virtual to practice
Trading involves the risk of losing the capital invested.
