

 Português pt
 Español es
 العربية ar
 বাংলা bn
 Deutsch de
 Filipino fil
 Français fr
 हिन्दी hi
 Bahasa Indonesia id
 Italiano it
 Русский ru
 Svenska sv
 ไทย th
 Türkçe tr
 Tiếng Việt vi
 简体中文 zh
Updated:
MarketsFiscal Year and Quarter (Q1–Q4): What They Are and Why They Matter
 Rafael AzevedoEditorial character · Markets Desk

Quick answer
A fiscal year is the 12-month period a company uses to close its books, and it doesn't always match the calendar year. Each fiscal year is split into four quarters, Q1 through Q4, at the end of which publicly traded companies report results. Apple, for example, closes its fiscal year at the end of September, so its Q1 runs from October through December.
Anyone who follows stocks sooner or later runs into abbreviations like Q1, Q2, Q3, and Q4, almost always tied to earnings releases. The detail that confuses a lot of people is that a company's Q1 isn't necessarily the first quarter of the calendar year: it depends on the fiscal calendar that company has adopted.
In this guide we explain what a fiscal year is, how quarters are split, and, using Apple's (AAPL) real daily quotes from Yahoo Finance in 2026, we show how to read a stock's behavior by the company's own calendar.
What a fiscal year is
A fiscal year is the twelve-month period a company uses to organize its accounting and report results for tax purposes and for the market. Many companies use the calendar year, from January to December, but others choose a period that follows the business cycle.
Some well-known examples in the United States:
- Apple: its fiscal year ends on the last Saturday of September. Fiscal Q1 runs from October to December, precisely the holiday shopping quarter.
- Microsoft: its fiscal year ends on June 30.
- Nvidia: it ends on the last Sunday of January; the company's fiscal 2026 ended on January 25, 2026.
- Walmart: it ends on January 31, after the year-end season and the returns that follow right behind it.
In Brazil, the vast majority of publicly traded companies use the calendar year. They file the Quarterly Information form (ITR) with the CVM for the first three quarters and the Standardized Financial Statements (DFP) at year-end close.

How fiscal quarters work
Each fiscal year is split into four three-month blocks, numbered Q1 through Q4 (the Q stands for quarter). For companies that follow the calendar year, Q1 is January through March, Q2 is April through June, Q3 is July through September, and Q4 is October through December.
For Apple, the math changes. Its fiscal 2026 quarters ended on these dates, all Saturdays:
- Fiscal Q1 2026: October through December 27, 2025
- Fiscal Q2 2026: through March 28, 2026
- Fiscal Q3 2026: through June 27, 2026
- Fiscal Q4 2026: through September 26, 2026
In other words, when Apple talks about Q3, it means April, May, and June, not July, August, and September. Comparing Apple's Q3 with the Q3 of a company that follows the calendar year means comparing different months.
Real example: Apple's stock through the 2026 fiscal calendar
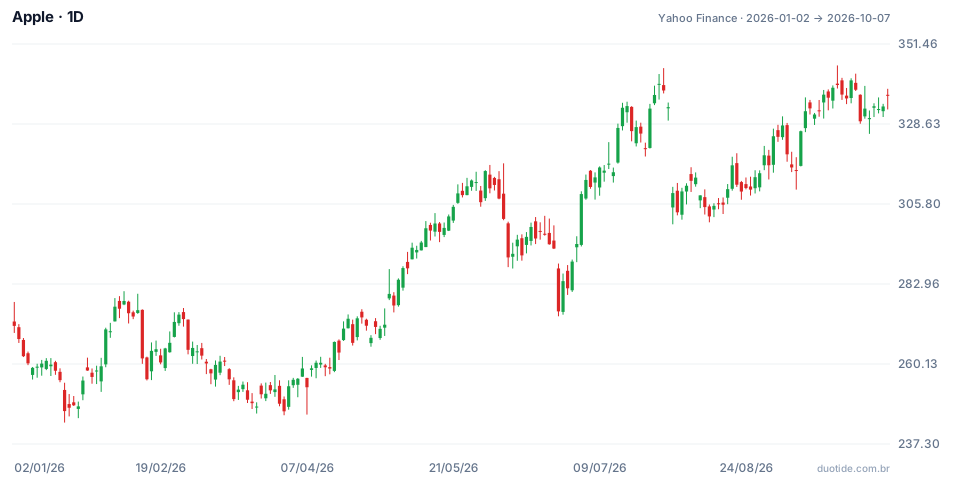
Between January 2 and October 7, 2026, Apple's stock went from US$ 271.01 to US$ 336.67, a gain of 24.23%, with a low of US$ 243.42 on January 20 and a high of US$ 345.34 on September 22. Measured by the company's own calendar, using the last close before the end of each fiscal quarter:
- Fiscal Q2: from US$ 273.40 (December 26, 2025) to US$ 248.80 (March 27, 2026) = −9.0%
- Fiscal Q3: from US$ 248.80 to US$ 283.78 (June 26, 2026) = +14.1%
- Fiscal Q4: from US$ 283.78 to US$ 341.07 (September 25, 2026) = +20.2%
These are stock price moves, not the company's reported results. Each quarter's results are only released weeks after the quarter closes, and that's usually when the stock reacts.
Unusually large moves
Across the 192 trading sessions in the window, Apple's average daily move, in absolute terms, was 1.21%. The biggest moves were well above that: a 7.35% drop on July 31 (from US$ 333.43 to US$ 308.91), a 6.12% drop on June 25, and a 5.00% drop on February 12. The July 31 move, six times the average, fell in the week Apple typically reports its fiscal third-quarter results. Here we're measuring price alone; before attributing any move to an earnings report, check the official date on the company's investor relations site.

How to use the fiscal calendar
Know the date of the next earnings report
Exchanges, financial sites, and investor relations departments publish the expected date for each release. Before keeping a position open, it's worth checking whether there's a report coming up in the next few days, since the release concentrates the risk of a sharp move.
Decide consciously about the position
Close to the date, there are three choices: keep the position knowing the risk, reduce its size, or close it beforehand. No prior analysis eliminates the chance of a surprise, in either direction.
Compare companies over the same period
When comparing results from different companies, line up the months, not the label. Q1 for an American retailer might cover February through April; Q1 for a Brazilian company, January through March.
Watch the history of reactions
Some stocks react more strongly than others to earnings. Tracking, quarter after quarter, the size of the move on the day after the release helps calibrate expectations and position size.
Limitations
The calendar tells you when risk increases, not which way the price will move. And the reaction depends on market expectations: a record profit can still send a stock down if it came in below what was expected.
Common mistakes about fiscal years and quarters
- Assuming Q1 is always January through March.
- Confusing the end of the fiscal quarter with the earnings release date, which comes weeks later.
- Keeping a large position open on earnings day without deciding to do so on purpose.
- Attributing every sharp move to earnings without checking the official date.
- Assuming one quarter's reaction pattern will repeat next time: the examples above describe what happened, not what will happen.
To practice without risking money, pick two or three stocks you follow, note down each one's fiscal calendar and the date of its next earnings report, and, on a demo account, record what the price did in the days before and after the release. Within a few quarters you'll have your own reference for the risk these dates carry.
Practice before you risk. Open your Duotide account and test your ideas on the demo account with US$10,000 in virtual funds.
Create free accountUpdated:
Editorial character of the Duotide newsroom. Articles are written by the team with the help of artificial intelligence; prices and charts come from real market data. Follows the news that moves prices — rates, stock markets, companies and commodities — explained without jargon.
Was this article helpful?
Be the first to rate it.
Comments
- No comments yet. Be the first to comment.
Ready to put it into practice?
Open your account and practice on the demo account with US$10,000 in virtual funds, without risking money.
- Secure platformProtected login and identity verification
- Multilingual supportHelp available every day
- Free demo accountUS$10,000 virtual to practice
Trading involves the risk of losing the capital invested.
