

 Português pt
 Español es
 العربية ar
 বাংলা bn
 Deutsch de
 Filipino fil
 Français fr
 हिन्दी hi
 Bahasa Indonesia id
 Italiano it
 Русский ru
 Svenska sv
 ไทย th
 Türkçe tr
 Tiếng Việt vi
 简体中文 zh
Updated:
MarketsHow AI Trading Bots Work in Practice
 Rafael AzevedoEditorial character · Markets Desk

Quick answer
An AI trading bot is a program that gathers data, generates buy or sell signals with a model trained on history, applies risk rules, and sends orders on its own. It only knows the past it was shown: pretty backtests are usually the result of overfitting and ignored costs. Before using one, you need to understand the rule, test out of sample, and run it on a demo account.
The promise behind an AI trading bot is usually the same: let the machine decide while profit shows up on its own. Anyone who tests this kind of tool carefully learns something else: turning the bot on is the easy part. The hard part is knowing why it trades, whether the tests behind it are realistic, and what happens when the market changes.
In this guide we explain a bot's decision chain, and to show how results depend on choices that look small, we tested 1,162 versions of a simple bot on real daily ETH/USDT quotes from Binance between April and October 2026.
What an AI trading bot is
A trading bot is a program that sends buy and sell orders following rules, without manual intervention. Every bot, with or without AI, goes through the same steps:
- Data: prices, volume, and sometimes news or social media data.
- Signal: the rule that decides whether to buy, sell, or stay out.
- Risk management: position size, stop, and loss limits.
- Execution: sending the order to the broker and tracking what was filled.
What makes an AI-powered bot different is the signal. Instead of a rule written by a person, such as buy when one average crosses another, the model learns patterns from historical data. That allows for more complex rules, but it doesn't change the fundamentals: the bot only knows the past it was shown.

How to tell whether a backtest is reliable
A backtest is the simulation of a strategy on past data. It's indispensable and, at the same time, the main source of illusion. The problem has a name: overfitting. The more parameters and combinations you test, the easier it is to find one that would have worked in the past purely by chance.
Three numbers help you evaluate any backtest:
- How many versions were tested before arriving at the one being shown.
- How many trades support the result: three trades prove nothing.
- How much the result changes with cost: redo the math with a bigger spread and fees.
Real example: 1,162 bots on ETH in 2026
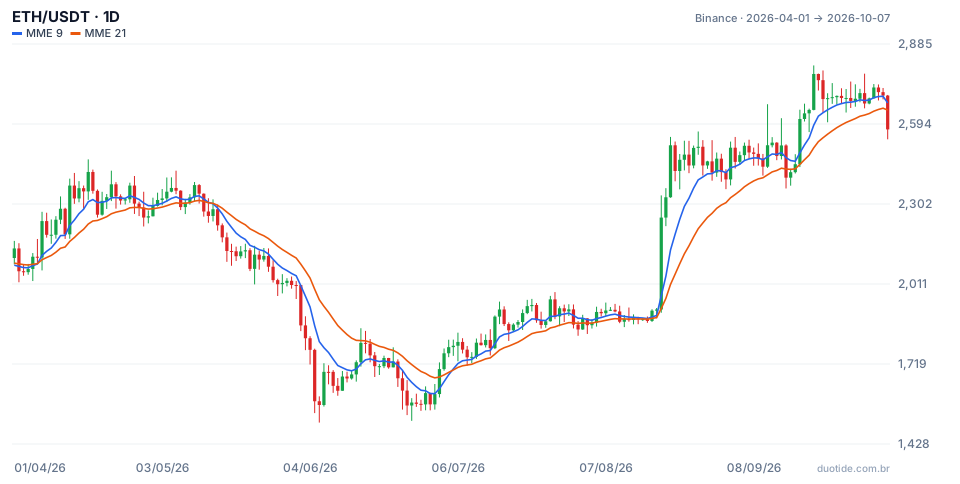
The chart shows ETH/USDT from April 1, 2026 (US$2,140.35) to October 7, 2026 (US$2,574.14), up 20.27%, with the 9- and 21-day exponential moving averages. Along the way, the price fell to a low of US$1,505.68 on June 6 and rose to a high of US$2,807.34 on September 21.
The crossovers of the 9-and-21 version
The simplest possible bot stays long while the 9-day average is above the 21-day average. During the period, there were three crossovers: a bullish one on April 7 (US$2,240.01; ten days later, +7.99%), a bearish one on May 14 (US$2,283.25; ten days later, −8.03%), and another bullish one on July 5 (US$1,785.65; ten days later, +7.4%). With a cost of 0.1% per position change, this version would have gained 46.5%, versus 20.27% for simply buying and holding. It stayed out of exactly the May-June decline.
But why 9 and 21?
We tested every combination of a fast average between 3 and 30 days and a slow average at least 3 days longer, up to 60 days: 1,162 versions of the same bot. With a cost of 0.1% per change:
- Best version (3- and 33-day averages): +54.5%, with only 3 position changes.
- Median version (13 and 39): +30.2%.
- Worst version (3 and 6): −1.4%, with 33 position changes.
- 176 versions ended up below simply buying and holding.
Whoever sells a bot shows the +54.5%, not the full list. And the best version's result rests on three trades, in a period that happened to have a long decline followed by a long rally, exactly the scenario where moving-average crossovers work best. In a sideways market, the same rule gets in and out all the time.
Cost changes the ranking
Redoing the math with 0.5% per position change, the worst version goes from −1.4% to −13.6%, because it flips sides 33 times. The versions that trade little barely change. A high-frequency bot with a pretty, zero-cost backtest is the most common case of a result that doesn't survive reality.

How to use and test a bot before risking money
Demand the rule, not just the result
You need to know under what conditions the bot buys, sells, and stays out. A system that can't be explained even in broad terms also can't be evaluated when it starts losing.
Separate training data from test data
Tune the parameters on one part of the history and test on another part the bot has never seen. Then run it for weeks on a demo account, in real time. A live result, even on demo, is worth more than any backtest.
Include cost, delay, and limits
Simulate with realistic spread, fees, and execution delay. Set a maximum daily loss and a kill switch: the bot doesn't know when the market has changed regime.
Limitations
The test in this article is deliberately simple: daily data, a single asset, six months, and a fixed cost. It's meant to show how the result depends on the parameters, not to recommend a rule. More complex AI models have even more parameters and, therefore, more room for overfitting. The numbers describe what happened, not what will happen.
Common mistakes with trading bots
- Trusting a backtest without knowing how many versions were tested beforehand.
- Ignoring costs: at 0.5% per trade, the worst version in the example went from −1.4% to −13.6%.
- Accepting results that rest on very few trades.
- Leaving the bot running without a loss limit or monitoring.
- Trusting promises of fixed or guaranteed gains: no system eliminates market risk.
- Changing the parameters after every loss, which is overfitting done by hand.
Before putting money into any automation, run it on a demo account for at least a few weeks and log every trade: entry, exit, cost, and reason. Compare the live result with the backtest. If the difference is large, the problem is in the test, not in the market.
Practice before you risk. Open your Duotide account and test your ideas on the demo account with US$10,000 in virtual funds.
Create free accountUpdated:
Editorial character of the Duotide newsroom. Articles are written by the team with the help of artificial intelligence; prices and charts come from real market data. Follows the news that moves prices — rates, stock markets, companies and commodities — explained without jargon.
Was this article helpful?
Be the first to rate it.
Comments
- No comments yet. Be the first to comment.
Ready to put it into practice?
Open your account and practice on the demo account with US$10,000 in virtual funds, without risking money.
- Secure platformProtected login and identity verification
- Multilingual supportHelp available every day
- Free demo accountUS$10,000 virtual to practice
Trading involves the risk of losing the capital invested.
