

 Português pt
 Español es
 العربية ar
 বাংলা bn
 Deutsch de
 Filipino fil
 Français fr
 हिन्दी hi
 Bahasa Indonesia id
 Italiano it
 Русский ru
 Svenska sv
 ไทย th
 Türkçe tr
 Tiếng Việt vi
 简体中文 zh
Updated:
BeginnersHow to Understand a Market Quote: Bid, Ask, Spread, and Change
 Marina CostaEditorial character · Beginner's Guide
Quick answer
A quote shows the buy price (ask), the sell price (bid), the difference between them (spread), and how much the asset moved over the period. You buy at the ask and sell at the bid, so the spread is a cost paid on every trade. The high, low, and percentage change show the size of the move and help size the stop and the target.
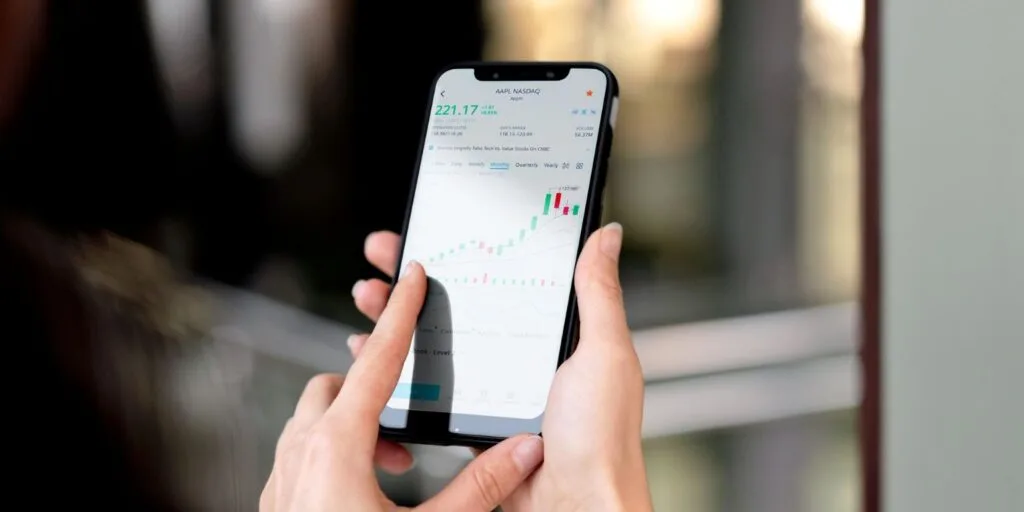
Anyone opening a trading platform for the first time finds a row of numbers next to each asset: two nearly identical prices, a green or red percentage, a high, a low, sometimes volume. Understanding what each one means is the first step before any analysis, because that's where the cost of the trade and the real size of the move live.
In this guide, we use the real daily quotes of the euro against the dollar (EUR/USD, from Yahoo Finance) between June and October 2026 to explain each number with real values.
What a market quote is
The quote is the price at which an asset can be traded at that moment. For stocks and indices, it's expressed in currency or in points. For currency pairs, like EUR/USD, it tells you how many units of the second currency are needed to buy one unit of the first: EUR/USD at 1.12535 means 1 euro costs 1.12535 dollars.

The numbers in a quote, one by one
- Bid (sell): the highest price someone is willing to pay right now. That's the price you sell at.
- Ask (buy): the lowest price someone will accept to sell at right now. That's the price you buy at.
- Spread: the difference between the ask and the bid. It's a cost paid on entering every trade.
- Open and close: the first and last price of the period (day, hour, minute).
- High and low: the highest and lowest prices traded during the period.
- Change: how much the price moved relative to the previous close, in value or in percentage.
- Volume: how much was traded. For stocks, it's the number of shares; in the currency market, there's no single central volume figure.
How to calculate spread, pip, and percentage change
Percentage change
The formula is: change = (current price ÷ previous close − 1) × 100. EUR/USD closed October 6, 2026, at 1.12171 and October 7 at 1.12535. The math works out to (1.12535 ÷ 1.12171 − 1) × 100 = +0.32%. It works the same way in the stock market: Apple closed October 6 at US$ 333.63 and October 7 at US$ 336.67, a change of +0.91%.
Pip
On most currency pairs, the pip is the fourth decimal place: 0.0001. On October 7, EUR/USD's high was 1.12562 and its low, 1.11661. The day's range was 1.12562 − 1.11661 = 0.00901, that is, 90.1 pips. On a standard lot of 100,000 euros, each pip is worth US$ 10; on a micro lot (1,000 euros), US$ 0.10.
Spread in money
Suppose, as a hypothetical example, the platform shows a bid of 1.12530 and an ask of 1.12540. The spread is 0.00010, or 1 pip. On a standard lot, anyone buying and selling at the same instant loses US$ 10 just from that difference. The trade starts negative by the size of the spread, and the price needs to move at least that much in its favor just to break even. Real spreads vary by platform, time of day, and asset, and tend to widen around news.
Real example: reading EUR/USD's quotes in 2026
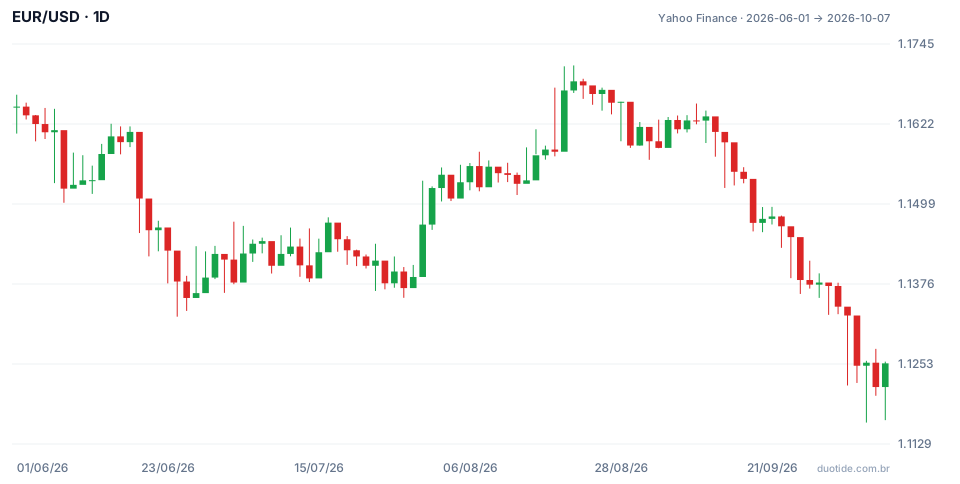
The chart shows one candle per day. Each candle sums up four numbers from the quote: open, high, low, and close. Between June 1 and October 7, 2026, the pair went from 1.16489 to 1.12535, down 3.39%. Three readings help turn these numbers into information.
The average range of a day
Over the period's 93 candles, the average difference between the high and the low was 47.6 pips. That's the "normal size" of a day in EUR/USD over this window. A 10-pip stop, for example, would sit inside the ordinary swing of any day, and a 300-pip target for a one-day trade would be way out of touch with reality.
The busiest day
The October 1 candle had a high of 1.13392 and a low of 1.12194: 119.7 pips, about two and a half times the average. On days like that, the spread tends to widen and orders can execute far from the planned price. Knowing the normal range lets you recognize when a day is out of pattern.
From the peak to the bottom
The period's high was 1.17123, on August 21, and the low, 1.11623, on October 5. The distance between them is 550 pips, or US$ 5,500 per standard lot. Looked at as a percentage, it seems small (about 4.7%), but on the scale of pips and leveraged lots it's a huge move. This describes what happened over this period; it doesn't say where the pair is headed.
How to use the quote day to day
Check the spread before trading
Compare the spread with the trade's target. If the target is 10 pips and the spread is 2, a fifth of the expected gain goes away on entry.
Look at the change together with the range
A day that closes up 0.32% can have swung 90 pips, as on October 7. The change shows only the final result; the high and low show the path.
Know which price the chart uses
Many platforms draw the chart from the bid. A buy order executes at the ask, which sits above it. That's why a buy can execute at a price the candle never showed.
Limitations
The quote shows the price, not the asset's fair value or its future direction. On thinly traded assets, the last quote can be stale and the spread, wide.
Common mistakes when reading a quote
- Confusing bid and ask and expecting to buy at the sell price.
- Ignoring the spread when calculating the result, especially on short trades.
- Looking only at the percentage change and forgetting the day's range.
- Calculating the pip value without accounting for the lot size.
- Trading during news hours without noticing the spread has widened.
To practice without risking money, open a demo account and note down, for one asset, the bid, the ask, the spread, the high, and the low at three different times of day, over a week. You'll see firsthand when the spread gets more expensive and what the normal swing is for the asset you plan to trade.
Practice before you risk. Open your Duotide account and test your ideas on the demo account with US$10,000 in virtual funds.
Create free accountUpdated:
Editorial character of the Duotide newsroom. Articles are written by the team with the help of artificial intelligence; prices and charts come from real market data. Answers the first questions of those just starting out: account, platform, basic concepts and common mistakes.
Was this article helpful?
Be the first to rate it.
Comments
- No comments yet. Be the first to comment.
Ready to put it into practice?
Open your account and practice on the demo account with US$10,000 in virtual funds, without risking money.
- Secure platformProtected login and identity verification
- Multilingual supportHelp available every day
- Free demo accountUS$10,000 virtual to practice
Trading involves the risk of losing the capital invested.
