

 Português pt
 Español es
 العربية ar
 বাংলা bn
 Deutsch de
 Filipino fil
 Français fr
 हिन्दी hi
 Bahasa Indonesia id
 Italiano it
 Русский ru
 Svenska sv
 ไทย th
 Türkçe tr
 Tiếng Việt vi
 简体中文 zh
Updated:
BeginnersTrading Tools: How to Choose the Right Ones to Get Started
 Marina CostaEditorial character · Beginner's Guide

Quick answer
There are five essential trading tools: a charting platform, an economic calendar, a position-size calculator, a trading journal, and a demo account. Choose them for day-to-day usefulness and execution quality, not for the number of features. None of them guarantee profit; they reduce impulsive decisions and calculation mistakes.
It's easy to confuse a tool with a strategy. A nice-looking chart, a thorough economic calendar, and a risk calculator don't guarantee profit, but not having them almost always gets in the way: a decision made without organized information tends to be an impulsive decision.
This guide lists the tools that make a difference day to day, explains what to look for in each one, and shows, with real Apple stock quotes between April and October 2026, how a simple position calculator changes the size of a trade based on volatility.
What trading tools are
They're the resources that help you analyze, decide, execute, and review trades. They can be grouped into five functions:
- Charting platform: where you follow price, apply indicators, and send orders.
- Economic calendar: release times for inflation, interest rates, jobs data, and company earnings.
- Position-size calculator: turns the accepted risk into a number of shares, lots, or contracts.
- Trading journal: a log of every entry, reason, size, and result.
- Demo account: an environment with fake money to test without financial cost.

How to calculate position size with the ATR
The position calculator is the most underrated tool for beginners. The logic has three steps:
- Risk in money: capital × accepted percentage per trade.
- Stop distance: how far price can move against you before you exit. A common approach is to use a multiple of the ATR, the asset's average daily range.
- Quantity = risk in money ÷ stop distance, always rounding down.
Example with real Apple data
Consider a $10,000.00 account risking 1% per trade, or $100.00. On October 7, 2026, Apple stock closed at $336.67 and the 14-day ATR was at $6.58.
- Stop at 1.5 ATR: 1.5 × 6.58 = $9.87 per share
- Quantity: 100.00 ÷ 9.87 = 10.13 → 10 shares
- Position value: 10 × 336.67 = $3,366.70
The same calculation on May 29, 2026, when the ATR was at its lowest level of the period ($5.57) and the stock closed at $312.06, gave a stop of $8.36 and 11 shares. On July 31, 2026, with the ATR at its highest level ($9.87), the stop widened to $14.81 and the quantity dropped to 6 shares. The risk in money stayed the same; what changed was the size, adjusted for volatility. Doing that in your head, on every trade, is where the mistakes show up.
Real example: what Apple's chart shows about these tools
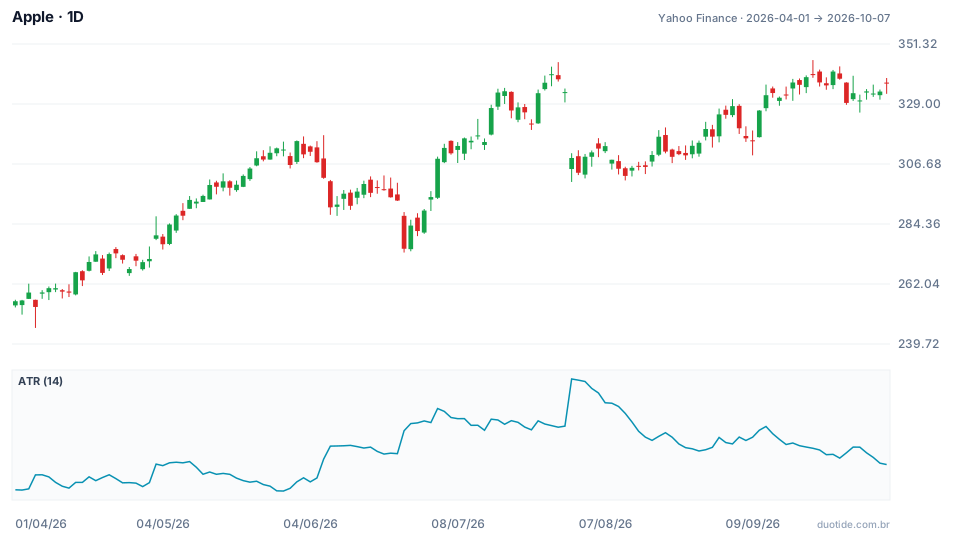
The chart shows Apple's daily price from April 1, 2026, to October 7, 2026, and, in the panel below, the 14-day ATR. Over the period the stock went from $255.63 to $336.67, up 31.7%, with a low of $245.70 on April 7 and a high of $345.34 on September 22.
July 31: the day the stop wasn't enough
On July 30 the stock closed at $333.43, with the ATR at $8.06. A stop at 1.5 ATR would sit at $321.34 (12.09 below), and the calculator would call for 8 shares, for a planned loss of $96.72. The next day the stock opened at $304.81, 8.58% below the previous close, with no trading in between. The stop would be triggered near the open: a loss of about $28.62 per share, or $228.96 on the 8 shares, 2.4 times what was planned. This is where the economic calendar (knowing when a major release is coming) and reading the platform's execution conditions come in.
After the jump: the ATR rose and the calculator shrank the position
The ATR went from 8.06 on July 30 to 9.87 on July 31, the period's highest value, and still read 9.83 on August 3. Anyone following the calculator traded with fewer shares over the following days without having to make that call in the heat of the moment. By October 7, with the market calmer, the ATR had come back down to 6.58.

How to choose each tool
Charting platform
Check whether it offers the timeframes you use, from intraday to daily, whether it lets you save indicator templates, and whether it has enough history for long averages, like the 200-period one. Test execution speed during busy hours: a platform that freezes while confirming an entry costs more than an analysis mistake.
Economic calendar
A good calendar filters by country and expected impact level. Use it before opening a position: if there's a rate decision, inflation data, or a company earnings report in the next few hours, you consciously decide whether you want to stay exposed to the jump that could come.
Position calculator
It can be a spreadsheet with three cells: capital, risk percentage, and stop distance. What matters is using it on every trade, not just when you remember to.
Trading journal
Log the date, asset, reason for the entry, size, stop, result, and a line about what worked. Reviewing the journal every week reveals patterns memory hides, like a time of day when results are always worse.
Demo account
It's useful for validating a method's logic without financial cost. It doesn't reproduce the emotional weight of risking real money, so use it to test rules, not to simulate the full experience.
Limitations
No tool eliminates risk. The ATR describes past volatility and doesn't predict the next jump, as July 31 showed. Spread, fees, and execution during volatile moments are also part of the picture: read the terms published by wherever you trade instead of assuming everything works the same way.
Common mistakes when choosing trading tools
- Piling up ten apps and indicators and not using any of them consistently.
- Setting position size by the money available in the account, instead of by the stop distance.
- Ignoring the calendar and keeping a position open through releases that tend to cause jumps.
- Trusting a tool sold with promises of guaranteed signals or assured returns.
- Not keeping a journal and repeating the same mistake without noticing.
- Forgetting that the examples above describe what happened, not what will happen.
To get started, put together a minimum set: charting platform, calendar, a position spreadsheet, and a journal. Use all of it on a demo account for a few weeks, logging every trade, and only then decide which extra tools your process actually needs.
Practice before you risk. Open your Duotide account and test your ideas on the demo account with US$10,000 in virtual funds.
Create free accountUpdated:
Editorial character of the Duotide newsroom. Articles are written by the team with the help of artificial intelligence; prices and charts come from real market data. Answers the first questions of those just starting out: account, platform, basic concepts and common mistakes.
Was this article helpful?
Be the first to rate it.
Comments
- No comments yet. Be the first to comment.
Ready to put it into practice?
Open your account and practice on the demo account with US$10,000 in virtual funds, without risking money.
- Secure platformProtected login and identity verification
- Multilingual supportHelp available every day
- Free demo accountUS$10,000 virtual to practice
Trading involves the risk of losing the capital invested.
