

 Português pt
 Español es
 العربية ar
 বাংলা bn
 Deutsch de
 Filipino fil
 Français fr
 हिन्दी hi
 Bahasa Indonesia id
 Italiano it
 Русский ru
 Svenska sv
 ไทย th
 Türkçe tr
 Tiếng Việt vi
 简体中文 zh
Updated:
MarketsIs SpaceX a Speculative Bubble? What the 2026 Numbers Say
 Rafael AzevedoEditorial character · Markets Desk

Quick answer
There's no way to say for sure: SpaceX debuted valued at more than $2 trillion, about 107 times its 2025 revenue, with a $4.9 billion loss, which only makes sense with extraordinary growth. SPCX shares rose 56.59% above the IPO price in three sessions, fell 48.78% through August, and closed on October 7 at $167.60, behavior typical of euphoria, but one that still neither confirms nor rules out a bubble.
Few stock market debuts have generated as much noise as SpaceX's in 2026. The company went public on the Nasdaq under the ticker SPCX valued at more than $2 trillion, putting it among the six largest listed companies in the United States. At the same time, the previous year's results showed a net loss of almost $5 billion.
That contrast is at the center of the debate: is the market pricing SpaceX's future reasonably, or inflating a bubble? Below are the numbers released at the IPO, the stock's real trajectory over the first four months, and the arguments from both sides. None of this is a recommendation to buy or sell.
What a speculative bubble is
A bubble is when an asset's price rises far above what its fundamentals support, driven by the expectation that someone will pay even more tomorrow. The classic signs are a valuation far removed from results, retail volume and attention well above normal, big daily swings, and capital flowing out of competitors into the name everyone's talking about.
The hard part is that those same signs show up in companies that later justify the valuation. A bubble is only confirmed over time, which is why an honest analysis separates what's fact from what's projection.

The debut's numbers
According to the final prospectus, SpaceX priced the offering at $135 a share and sold 555,555,555 Class A shares, raising about $75 billion, double the previous IPO record. Retail investor demand added up to more than $100 billion in orders.
On the first trading day, June 12, 2026, the stock opened at $150, reached $176.52, and closed at $160.95, up 19.22% from the offering price. 519.2 million shares traded that day.
How to measure the size of the bet
A simple way to see how much of the future is already in the price is to divide the market cap by annual revenue.
- 2025 revenue, according to the released figures: $18.7 billion.
- Market cap at the debut: more than $2 trillion.
- Price ÷ revenue = 2,000 ÷ 18.7 = about 107 times revenue.
- 2025 net loss: $4.9 billion; free cash flow: negative $13.8 billion.
Paying more than a hundred times the revenue of a company that's still burning cash only makes sense if it grows extraordinarily for many years. Bank projections cited at the time talked about revenue in the hundreds of billions of dollars by the end of the decade, driven by satellite internet and AI infrastructure. Those are projections, not facts.

Real example: SPCX's first four months
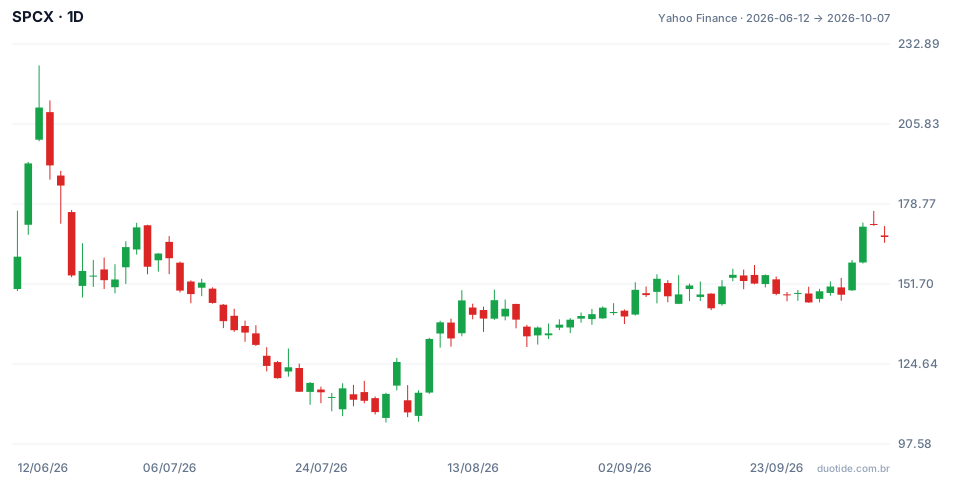
The chart shows SPCX's daily candles from June 12 to October 7, 2026. The trajectory shows the three typical phases of a highly contested debut.
Euphoria: +56.59% in three sessions
On June 16 the stock closed at $211.39, 56.59% above the offering price, and the day's high, $225.64, was 67.14% above it. The first week's average volume was 288.9 million shares a day, almost four times July's average (72.4 million).
Correction: −48.78% through August
As early as June 17 the stock fell 9.26%, and on June 22, another 16.43%. The lowest close came on August 5, at $108.27: 48.78% below the June 16 peak and 19.80% below the IPO price. The intraday low was $104.83, on August 3. Anyone who bought at the peak of the euphoria lost almost half in seven weeks.
Recovery: +54.80% from the bottom
On October 7 the stock closed at $167.60, 54.80% above August's bottom and 24.15% above the offering price. Of the period's 80 daily moves, 19 were 5% or more, up or down. These numbers describe what happened; they don't say whether the valuation is fair or where the stock is headed.
How to read the debate
The case that it isn't just speculation
SpaceX brings together reusable rocket launches, satellite internet (Starlink), government and defense contracts, and, after combining with an AI company, computing infrastructure. It's a combination with no direct comparison in any sector, which makes any traditional multiple of limited use, in either direction.
The skeptics' case
The prospectus carried dozens of pages of risk factors, including dependence on the founder and competition in AI infrastructure. One research firm estimated close to a 40% probability for a bearish scenario, with a value well below half the IPO valuation. And shares of smaller space-sector companies fell right after the debut, a sign of capital migrating toward the most talked-about name.
What to watch from here on
Starlink's revenue and margin quarter by quarter, the AI segment's cash burn, the end of early investors' lock-up periods, and daily volume, which shows whether interest holds up once the initial euphoria fades.
Limitations
The prospectus numbers and the projections reflect the moment of the IPO and may have changed since. Calling something a bubble too early is as risky as ignoring the signs: bubbles can last for years, or simply never be confirmed.
Common mistakes when analyzing a debut like SpaceX's
- Confusing a company's fame with the safety of its stock.
- Buying in the first few days chasing the news, when volume and swings are at their peak.
- Treating end-of-decade revenue projections as if they were already results.
- Trading a stock that swings 5% in a day with the same position size as an index.
- Forgetting that both the bubble thesis and its opposite are hypotheses, not facts.
To practice without risking money, follow SPCX or another recent debut in a demo account, set the position size before each trade based on the stock's daily swing, and record the result. With newly listed stocks, a trading journal usually teaches fast how much volatility weighs in.
Practice before you risk. Open your Duotide account and test your ideas on the demo account with US$10,000 in virtual funds.
Create free accountUpdated:
Editorial character of the Duotide newsroom. Articles are written by the team with the help of artificial intelligence; prices and charts come from real market data. Follows the news that moves prices — rates, stock markets, companies and commodities — explained without jargon.
Was this article helpful?
Be the first to rate it.
Comments
- No comments yet. Be the first to comment.
Ready to put it into practice?
Open your account and practice on the demo account with US$10,000 in virtual funds, without risking money.
- Secure platformProtected login and identity verification
- Multilingual supportHelp available every day
- Free demo accountUS$10,000 virtual to practice
Trading involves the risk of losing the capital invested.
