

 Português pt
 Español es
 العربية ar
 বাংলা bn
 Deutsch de
 Filipino fil
 Français fr
 हिन्दी hi
 Bahasa Indonesia id
 Italiano it
 Русский ru
 Svenska sv
 ไทย th
 Türkçe tr
 Tiếng Việt vi
 简体中文 zh
Updated:
Technical analysisThe 10 Laws of Technical Trading, With Real Examples
 Naomi TanakaEditorial character · Analysis Desk

Quick answer
The 10 laws of technical trading are classic principles split into two groups: reading the market (follow the trend, don't fight the price, confirm with volume, remember that patterns repeat, and check more than one timeframe) and discipline (use a stop, cut losses fast, don't overtrade, calculate position size, and stick to the plan). They don't guarantee being right: they work as a filter to decide whether a trade makes sense and how much to risk on it.
Over the decades, technical analysis has built up a set of principles that show up in practically every serious piece of material on the subject. They aren't formulas or guarantees of being right: they're practical observations about how price tends to behave and about the mistakes that most often bring down traders who operate without them.
We've gathered ten of these laws here, split into two groups: discipline and reading the market. For each group, we show what they would have said on the ether's real daily chart (ETH/USDT on Binance) between March and October 2026.
What the laws of technical trading are
These are rules of thumb that summarize what technical analysis considers most important: trading with the trend, confirming what the price shows, and controlling risk before thinking about profit. They don't replace a strategy with entry and exit rules; they work as a filter to check whether a trade makes sense.

Laws on trend and market structure
- 1. The trend is your friend. Trading in the direction of the dominant price move requires less accuracy than trying to guess reversals. Trading against it calls for a stronger reason.
- 2. Don't fight the market. If price ignores a level that should have held, the mistake is in the reading. Recognizing that early avoids bigger losses.
- 3. Volume confirms price. A breakout with volume well above average has more participants behind it than the same move on a weak day.
- 4. History tends to repeat itself. Chart patterns work, when they work, because they reflect recurring fear and greed, not because they predict the future.
- 5. Confirm across more than one timeframe. A signal on the 15-minute chart carries more weight when the daily chart points the same way.
Laws on risk and discipline
- 6. Use a stop on every trade. Defining the exit before entering keeps a small loss from turning into a big one.
- 7. Let profits run and cut losses fast. The natural impulse is the opposite: exit winners early and hold onto losers.
- 8. Don't overtrade. Every entry needs a technical reason. Trading out of boredom or anxiety eats into the account through costs and rushed decisions.
- 9. Calculate position size before entering. Risking a fixed percentage of the account keeps risk proportional, whether the account grows or shrinks.
- 10. Discipline beats prediction. An imperfect plan followed consistently tends to pay off more than a brilliant analysis abandoned halfway through.

Real example: the laws on the ether chart in 2026
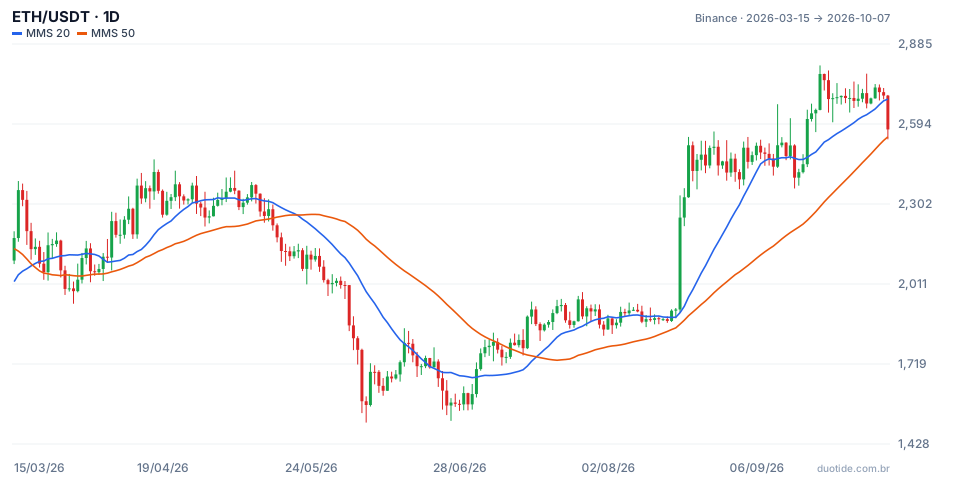
The chart shows ETH/USDT from March 15, 2026 to October 7, 2026 with the 20-day (blue) and 50-day (orange) simple moving averages. Over the period, the price went from US$ 2,178.30 to US$ 2,574.14, a gain of 18.17%, with a low of US$ 1,505.68 on June 6 and a high of US$ 2,807.34 on September 21.
Laws 1 and 2: when price lost the 50-day average
On May 15 ether closed at US$ 2,224.66, below the 50-day average (US$ 2,250.73). The trend that had been building since April had turned. Anyone who kept buying because the price looked cheap saw the low of US$ 1,505.68 on June 6, 32.3% below that close. Fighting the market, in this case, was costly.
Law 3: the volume behind August's breakout
On August 19 ether rose 17.5% in a single day, from US$ 1,917.85 to US$ 2,252.80. Trading volume was 5.23 times the average of the previous 20 days, and stayed above 3.5 times the average for the next two days. On August 21 the price closed at US$ 2,516.30. A move with high volume shows broad participation; it doesn't guarantee continuation, but it carries more weight than a rally on a weak-volume day.
Law 9: position size on the return above the average
On July 10 the price closed back above the 50-day average, at US$ 1,796.85, and didn't close below it again until October 7. Suppose an account of US$ 8,000 and a rule of risking 1% per trade:
- Maximum risk: 1% of US$ 8,000 = US$ 80.
- Stop at twice the 14-day ATR for that day (US$ 77.00): a distance of US$ 154.00, with the stop at US$ 1,642.85.
- Size: US$ 80 ÷ US$ 154.00 = 0.519 ETH, about US$ 933 in position.
The lowest low after that was US$ 1,750.20, on July 13, far from the stop. By October 7 the price was 43.3% above the entry. These are facts from the period analyzed, not an indication of what will happen next.
How to use the 10 laws
As a checklist before every entry
Before opening a trade, ask: am I with the larger trend? Does volume confirm it? Where's the stop and how much does it cost in money? If any answer is I don't know, the trade isn't ready yet.
As a diagnosis after losses
For every losing trade, note which law was set aside. After a few weeks, the pattern shows up: often the problem isn't the analysis, but a stop that got moved or a position that was too large.
Laws that reinforce each other
Identifying the trend (law 1) and confirming it with volume (law 3) doesn't help if position size (law 9) or the stop (law 6) get ignored. They work as a set.
Limitations
The laws describe tendencies in price behavior, not certainties. Averages lag, high volume sometimes marks the end of a move rather than the beginning, and markets change regime without warning. None of them removes the risk of loss.
Common mistakes when applying the laws of technical trading
- Repeating the trend law and, in practice, buying every sharp drop because the price looks cheap.
- Using a stop, but moving it farther away as the price gets close.
- Calculating position size by how much you want to make, instead of how much you're willing to lose.
- Reading volume on assets and at times with low liquidity, where it distorts the picture.
- Treating one example that worked out as proof that the rule always works.
To practice, open the daily chart of the asset you follow on a demo account, add the 20- and 50-period averages, and apply the ten laws as a checklist on every simulated trade. Log which law weighed on each decision and the result; within a few weeks you'll have your own data on which ones make the biggest difference to how you trade.
Practice before you risk. Open your Duotide account and test your ideas on the demo account with US$10,000 in virtual funds.
Create free accountUpdated:
Editorial character of the Duotide newsroom. Articles are written by the team with the help of artificial intelligence; prices and charts come from real market data. Explains charts, indicators and trading strategies: how they work, where they fail and how to test them first.
Was this article helpful?
Be the first to rate it.
Comments
- No comments yet. Be the first to comment.
Ready to put it into practice?
Open your account and practice on the demo account with US$10,000 in virtual funds, without risking money.
- Secure platformProtected login and identity verification
- Multilingual supportHelp available every day
- Free demo accountUS$10,000 virtual to practice
Trading involves the risk of losing the capital invested.
