

 Português pt
 Español es
 العربية ar
 বাংলা bn
 Deutsch de
 Filipino fil
 Français fr
 हिन्दी hi
 Bahasa Indonesia id
 Italiano it
 Русский ru
 Svenska sv
 ไทย th
 Türkçe tr
 Tiếng Việt vi
 简体中文 zh
Updated:
Technical analysisFibonacci Retracement: Practical Example With Gold
 Naomi TanakaEditorial character · Analysis Desk
Quick answer
A Fibonacci retracement marks the 23.6%, 38.2%, 50%, 61.8%, and 78.6% levels of a prior move, where the price correction tends to find pauses. The calculation is the high minus the move's range multiplied by the percentage. The levels are zones of attention, not guaranteed points: in gold in 2026, the 61.8% level held twice and broke on the third try.
The Fibonacci retracement is one of the most used tools in technical analysis, and also one of the most poorly applied. The idea is simple: after a strong move, the partial correction tends to find pauses at certain proportions of the previous move. The problem shows up when someone treats these levels as exact, guaranteed entry points, instead of zones of attention.
In this guide, instead of a made-up example, we use gold's real daily quotes (the Comex futures contract, in dollars per ounce) between March and October 2026. There were two big moves, one down and one up, and each one shows a different side of the tool.
What the Fibonacci retracement is
The levels come from ratios tied to the sequence described by the Italian mathematician Leonardo Fibonacci. You don't need to understand the math to use the tool; what matters are the percentages:
- 23.6%: a shallow correction, common in very strong trends.
- 38.2%: a moderate correction.
- 50%: not a Fibonacci ratio, but included because it's so widely watched.
- 61.8%: the so-called golden ratio, the most closely followed level.
- 78.6%: a deep correction; below it, many consider the original move to have lost its validity.
There's no law of nature that makes the price stop at these points. Part of the levels' strength comes from the fact that many participants are watching the same prices, which concentrates orders there.

How to calculate the Fibonacci retracement
You choose a clear move, mark the start point and the end point, and apply the percentages to the distance between them. On an upward move, the levels sit below the top:
- Level = high − (high − low) × percentage.
- On a downward move, it's the opposite: level = low + (high − low) × percentage.
Example with gold's rally between June and August
Gold marked a low of $3,955.40 on June 30, 2026 and rose to a high of $4,755.00 on August 25, 2026. The move's range was 4,755.00 − 3,955.40 = $799.60.
- 23.6%: 799.60 × 0.236 = 188.71 → 4,755.00 − 188.71 = $4,566.29
- 38.2%: 799.60 × 0.382 = 305.45 → $4,449.55
- 50%: 799.60 × 0.5 = 399.80 → $4,355.20
- 61.8%: 799.60 × 0.618 = 494.15 → $4,260.85
- 78.6%: 799.60 × 0.786 = 628.49 → $4,126.51
Real example: gold in 2026
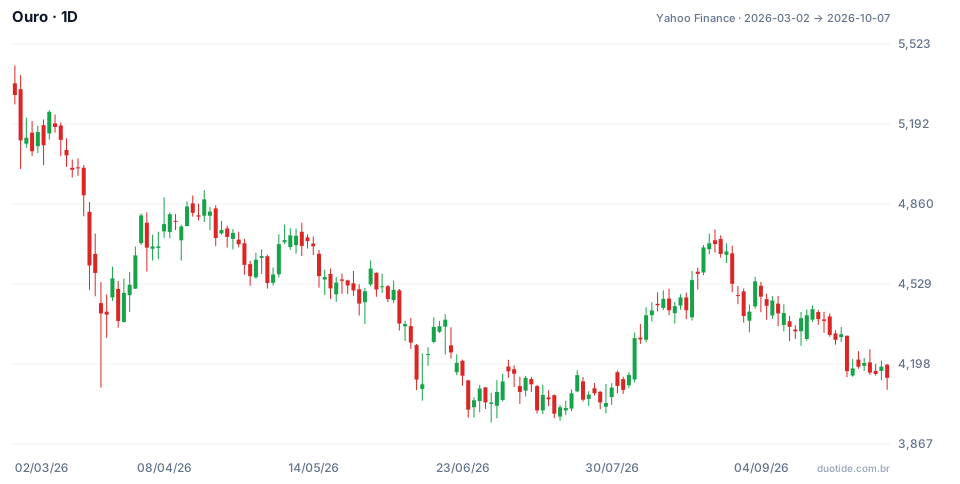
The chart shows gold's daily candles from March to October 2026. Over the period, the price fell 22%, from $5,311.60 at the March 2 close to $4,140.70 on October 7. Three situations show what the levels did and what they didn't do.
March and April: the correction stopped near 61.8%
Gold fell from a high of $5,434.10 on March 2 to $4,100.00 on March 23, a drop of $1,334.10. Since it was a downward move, the retracement levels sit above the low: 38.2% at $4,609.63, 50% at $4,767.05, and 61.8% at $4,924.47. The recovery passed through the first two and reached $4,917.70 on April 17, a 61.3% retracement, less than $7 from the 61.8% level. From there the price fell again: on May 4 the low was $4,510.10, and on June 30, gold made a new low for the period.
September: the 61.8% level held twice
In the correction of the June-to-August rally, the price fell to $4,329.20 on September 2, below the 50% level, and bounced back to $4,558.50 the next day. On September 16, another drop took the low to $4,273.30, about $12 above the 61.8% level ($4,260.85), and the price climbed back to $4,439.80 on September 18. Up to this point, the classic reading that the uptrend was still alive seemed to work.
Late September: the level broke
On September 28, gold opened at $4,315.00 and reached $4,143.10 the same day, breaking well below the 61.8% level. On October 7 the low was $4,091.20, also below the 78.6% level ($4,126.51): the correction had already given back 83% of the entire rally. Anyone who bought at 61.8% without a stop watched the level that had held twice stop working the third time.

How to use the Fibonacci retracement
Choose clear moves
The tool only makes sense on an obvious move, with a start and end that anyone would mark in the same place. If you have to force the points, the result is arbitrary.
Treat the levels as zones
In April, the reaction happened less than $7 from the 61.8% level; in September, about $12 away. Waiting for the exact price makes you miss the reaction or enter too early. A band around the level, combined with a sign of price reaction, works better.
Look for confluence
A Fibonacci level that lines up with a previous support, an important moving average, or a round number tends to be more closely watched. An isolated level, in the middle of nowhere, deserves less confidence.
Set the stop beyond the next level
If you enter at 61.8%, a stop just below 78.6% (or the move's origin) marks the point where the idea stops being valid. On September 28, that exact stop was what separated a controlled loss from a big one.
Limitations
Choosing the points is subjective and changes the levels. With five levels close together, almost always one of them looks like it worked when you look back at the chart later. And the tool knows nothing about news, interest rates, or flow: it organizes the reading, it doesn't predict the next move.
Common mistakes with the Fibonacci retracement
- Buying or selling at the exact level without waiting for any price reaction.
- Picking the top and bottom conveniently so the levels land where you want them.
- Trading without a stop because the level held last time, as happened in September 2026.
- Drawing Fibonacci on small moves on minute charts, where the levels turn into noise.
- Using the tool in isolation, without trend, support, resistance, or volume.
- Forgetting that history doesn't guarantee the future: the examples above describe what happened, not what will happen.
To practice without risking money, open the chart of the asset you follow in a demo account, draw the retracement on the clearest moves of the past few weeks, and write down which level the price reacted at, if it reacted, and what came after. After a few records, you'll have a concrete sense of how much the tool helps in your market.
Practice before you risk. Open your Duotide account and test your ideas on the demo account with US$10,000 in virtual funds.
Create free accountUpdated:
Editorial character of the Duotide newsroom. Articles are written by the team with the help of artificial intelligence; prices and charts come from real market data. Explains charts, indicators and trading strategies: how they work, where they fail and how to test them first.
Was this article helpful?
Be the first to rate it.
Comments
- No comments yet. Be the first to comment.
Ready to put it into practice?
Open your account and practice on the demo account with US$10,000 in virtual funds, without risking money.
- Secure platformProtected login and identity verification
- Multilingual supportHelp available every day
- Free demo accountUS$10,000 virtual to practice
Trading involves the risk of losing the capital invested.
