

 Português pt
 Español es
 العربية ar
 বাংলা bn
 Deutsch de
 Filipino fil
 Français fr
 हिन्दी hi
 Bahasa Indonesia id
 Italiano it
 Русский ru
 Svenska sv
 ไทย th
 Türkçe tr
 Tiếng Việt vi
 简体中文 zh
Updated:
Technical analysisPrice Gaps: What They Are, Why They Happen, and How to Trade Them
 Naomi TanakaEditorial character · Analysis Desk

Quick answer
A price gap is a jump between one period's close and the next one's open, with no trades in between. It happens because news and orders pile up while the market is closed. Gaps matter because they can make a stop fill far from the planned price, and because many gaps get filled later on, though not all of them.
On a candlestick chart, a gap appears as an empty space between one candle and the next. The name comes straight from the English word for an opening or void. It's more common in markets that close for a few hours, like stocks, than in markets that run continuously, like most of forex and crypto.
In this guide we use real daily quotes for Microsoft stock between April and October 2026 to count how many gaps there were, how many got filled, and what a gap does to a stop order.
What a price gap is
There are two ways to measure it. The simplest compares the open with the previous close: if the stock closed at $100.00 and opened at $103.00, there was a 3% jump at the open. The stricter way, used here, requires the entire candle to sit outside the previous candle: the day's low above the prior day's high (an up gap) or the day's high below the prior day's low (a down gap). In that case, there's a price range where no trades happened at all.

Why price jumps instead of walking
Outside trading hours, the news keeps coming: quarterly earnings, rate decisions, economic data, political events. Since no one can trade while the market is closed, that information piles up and gets processed all at once at the open. The opening price already reflects the new information, with no trading in between.
The four types of gap
- Common gap: happens within a sideways range, with low volume or low-impact news. Tends to be filled quickly.
- Breakaway gap: breaks out of a consolidation and starts a new move, usually with high volume.
- Continuation gap: appears in the middle of a trend and reinforces the move already underway.
- Exhaustion gap: shows up near the end of a long move, as a last push before a reversal, and tends to be filled soon.
Real example: Microsoft's gaps in 2026
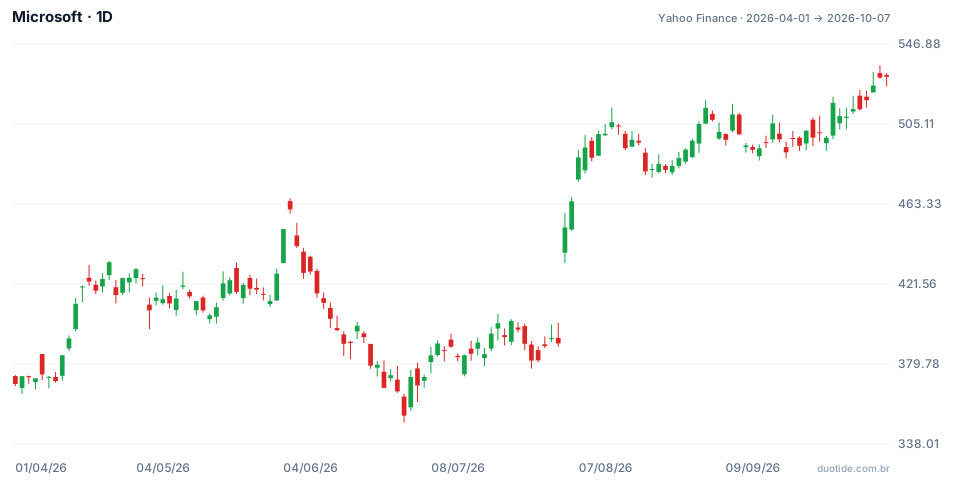
Between April 1, 2026, and October 7, 2026, Microsoft stock went from $369.37 to $529.76, up 43.4%, with a low of $349.20 on June 25 and a high of $535.69 on October 6. Over that period, in 131 sessions, we counted 25 gaps under the strict criterion. Of those, 23 were filled by October 7, 17 of them within five sessions. By the simple measure, 47 sessions opened more than 1% away from the previous close.
July 30: the gap that didn't close
The stock closed July 29 at $390.54, with a high of $401.25. On July 30 it opened at $437.90, 12.1% higher, and the day's low was $432.44. That left a $31.19 gap with no trades. The session closed at $451.10, up 15.5% on the day. Through October 7 the price never came back into that range: the lowest low after the jump was $449.33, on July 31. Based on what followed, it was a breakaway gap, but that only became clear afterward.
April 30: a down gap filled in two sessions
On April 29 the stock closed at $424.46, with a low of $420.29. On April 30 it opened at $410.81, a 3.2% drop at the open, and closed at $407.78. On May 4, two sessions later, the price traded above $420.29 again and the gap was filled.
June 2: a fill that took almost two months
On June 2 the stock opened at $446.88, below the previous day's low ($458.27), and fell to $349.20 by June 25. The gap was only filled on July 30, right on the jump higher. Filling is common, but it has no deadline.

How to use gaps
Protect the stop from the jump
A stop order, on paper, triggers at a set price. If the market opens beyond it, execution happens at the first available price, an effect called slippage. Example with April 30: someone who bought 100 shares at $424.46 with a stop at $415.00 planned to lose $946.00. With the open at $410.81, the loss would be about $1,365.00, 44% more than planned. Size the position accounting for that risk, especially ahead of quarterly earnings.
Include gaps in your volatility measure
The ATR uses the true range, which accounts for the distance between the previous close and the day's high or low, precisely so it doesn't ignore jumps. Measuring only the range within the candle underestimates the risk of assets that gap often.
Use filling as a reference, not a certainty
Some traders use the gap's range as a target for a counter-trend trade, mainly on common and exhaustion gaps. Microsoft's data shows many gaps closed quickly, but the biggest one took more than two months.
Limitations
Classifying the type of gap at the moment it appears is hard; the classification usually only becomes clear afterward. Counts from one period and one asset don't hold up as a general statistic, and the examples above describe what happened, not what will happen.
Common mistakes when dealing with gaps
- Assuming every gap will be filled and trading against it with no stop.
- Trusting the stop will fill exactly at the set price.
- Keeping a large position through an earnings release without considering the possible jump.
- Confusing a breakaway gap with an exhaustion gap without looking at volume and context.
- Ignoring gaps when measuring an asset's volatility.
To practice, open the daily chart of a stock you follow on a demo account, mark the gaps from the last few months, and note how many were filled and how long it took. That record gives you a concrete sense of that asset's behavior before you risk money.
Practice before you risk. Open your Duotide account and test your ideas on the demo account with US$10,000 in virtual funds.
Create free accountUpdated:
Editorial character of the Duotide newsroom. Articles are written by the team with the help of artificial intelligence; prices and charts come from real market data. Explains charts, indicators and trading strategies: how they work, where they fail and how to test them first.
Was this article helpful?
Be the first to rate it.
Comments
- No comments yet. Be the first to comment.
Ready to put it into practice?
Open your account and practice on the demo account with US$10,000 in virtual funds, without risking money.
- Secure platformProtected login and identity verification
- Multilingual supportHelp available every day
- Free demo accountUS$10,000 virtual to practice
Trading involves the risk of losing the capital invested.
