

 Português pt
 Español es
 العربية ar
 বাংলা bn
 Deutsch de
 Filipino fil
 Français fr
 हिन्दी hi
 Bahasa Indonesia id
 Italiano it
 Русский ru
 Svenska sv
 ไทย th
 Türkçe tr
 Tiếng Việt vi
 简体中文 zh
Updated:
Technical analysisHead and Shoulders: How to Identify It and Calculate the Target
 Naomi TanakaEditorial character · Analysis Desk

Quick answer
Head and shoulders (H&S) is a reversal chart pattern formed by three peaks: a taller central one, the head, between two smaller, similar ones, the shoulders. It's only confirmed when the price closes below the neckline, which connects the troughs between the peaks. The classic target is the height from the head to the neckline projected downward from the breakout, but it's a reference, not a guarantee: many patterns break out and never get there.
Head and shoulders is one of the best-known chart patterns, and precisely because of that, one of the most often seen where it doesn't exist. Any three peaks are enough for someone to see a head and two shoulders. The real pattern has clear conditions, and even when all of them show up, the outcome isn't guaranteed.
In this guide we explain the pattern's parts, how to measure the target, and, instead of an idealized drawing, we show a real case: Nvidia's (NVDA, Yahoo Finance data) daily quotes between April and August 2026, with the numbers for each point and what the price did after the breakout.
What the Head and Shoulders Pattern Is
It's a reversal pattern that shows up after an uptrend and suggests buyers are losing strength. It has five elements:
- Prior trend: without a rally before it, there's nothing to reverse.
- Left shoulder: the price makes a peak and pulls back to a trough.
- Head: the price rises past the previous peak, makes a higher high, and pulls back again, usually close to the first trough.
- Right shoulder: a new rally, which stays below the head and roughly level with the left shoulder, followed by a decline.
- Neckline: the line connecting the two troughs. The pattern is only confirmed with a close below it.
The logic is one of a sequence of attempts: at the head, buyers still manage a new high; at the right shoulder, they no longer can; at the neckline breakout, sellers push the price below the point where buyers had been defending it.
The inverted version, with three troughs and the head as the lowest one, shows up after declines and suggests a reversal to the upside. The rules are the same, mirrored.

How to Calculate the Head and Shoulders Target
- Pattern height = the head's high − the neckline at the same point.
- Target = neckline breakout point − pattern height.
Example with Real Nvidia Numbers
Using daily closes and, to keep it simple, a horizontal neckline at the lowest trough:
- Head: close of $235.74 on May 14, 2026
- Neckline: trough of $196.50 on May 5 (the other trough was $200.42 on June 10)
- Height = 235.74 − 196.50 = $39.24
- Target = 196.50 − 39.24 = $157.26
If the line connected the two troughs, it would tilt slightly upward and the breakout would come a bit sooner. Both approaches are used; what matters is deciding the rule before looking at the result.
Real Example: Nvidia's Head and Shoulders in 2026
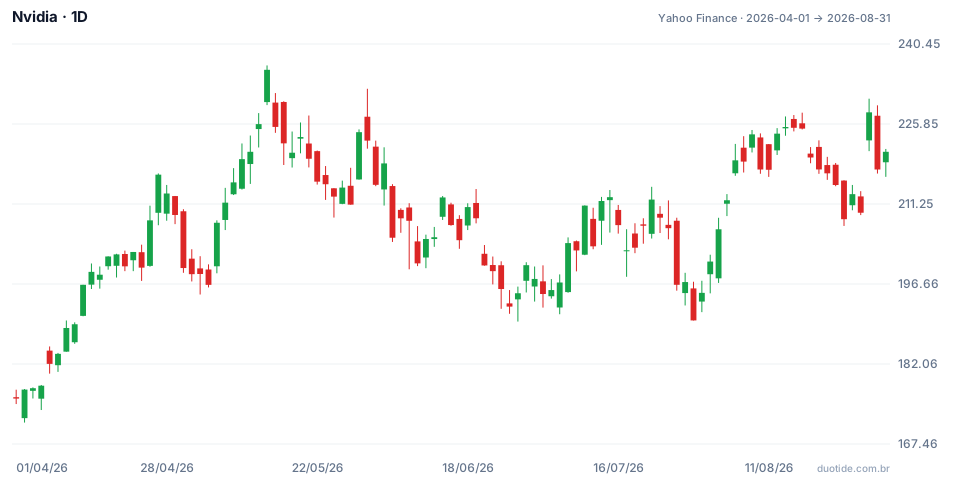
Nvidia started April at $175.75 and rose 34.1% to the close of $235.74 on May 14. That's the prior trend the pattern needs. After that, the shape formed like this:
The Three Peaks
The left shoulder came on April 27, with a close of $216.61, followed by a pullback to $196.50 on May 5. The head was the May 14 peak (intraday high of $236.54, the period's highest). The following decline took the stock to $200.42 on June 10, with an attempted bounce along the way, on June 1 and June 2. The right shoulder closed at $212.45 on June 15, four dollars below the left shoulder, a reasonable symmetry. Volume also helped the read: 187 million shares at the left shoulder, 180 million at the head, and 149 million at the right shoulder, a sign of less buying interest at each peak.
The Breakout
On June 25 the stock closed at $195.74, below the $196.50 neckline, and the next day it fell to $192.53. By the rules, the pattern was confirmed.
What Happened Next
By June 30 the stock had already moved back above the neckline, to $200.09. It swung above and below that line through July and made its lowest close after the breakout on July 29, at $190.01, only 2.9% below the June 25 close and far from the $157.26 target. By August 5 it was already at $219.22, above the right shoulder, and on August 13 at $225.30. The pattern was textbook, the breakout happened, and the expected move never came. That's common, and it's why every H&S-based plan needs a stop.

How to Use the Head and Shoulders Pattern
Wait for the Close Below the Neckline
Before the breakout, what exists is a possible pattern. Many right shoulders turn out to be just a correction within the rally. Entering before confirmation is betting on the drawing, not the pattern.
Where the Stop Goes
The most used reference is above the right shoulder. In Nvidia's case, anyone who sold the June 25 breakout at $195.74 with a stop above the right shoulder ($212.45) was risking $16.71 per share. That stop was hit on July 14, when the day's high reached $212.55, after three weeks of chop; a tighter stop, just above the neckline, would have been triggered as early as June 30.
Retest of the Neckline
After breaking out, the price often comes back to test the neckline from below. Some traders prefer to enter on that retest, with a tighter stop. The risk is what happened on June 30: the price came back and moved past the line.
Treat the Target as a Reference
The measured target is a point for assessing whether the risk-reward ratio makes sense, not a forecast. Taking partial profits before the target and adjusting the stop as the price moves are ways to avoid depending on it.
Limitations
The pattern is subjective: two people can draw the neckline in different places, and that choice changes the breakout point and the target. It also doesn't take into account news, earnings, or the market as a whole, which weighed heavily on Nvidia during this period.
Common Mistakes When Trading the Head and Shoulders
- Seeing the pattern in any sequence of three peaks, without an uptrend before it.
- Selling before the close below the neckline.
- Trading without a stop because the pattern looks perfect.
- Treating the calculated target as a sure thing and holding the position waiting for it.
- Redrawing the neckline after the fact to make the pattern look like it worked.
- Forgetting that the example above describes what happened, not what will happen.
To practice, look for head and shoulders patterns on the daily chart of assets you follow in your demo account, note down where you drew the neckline, the breakout point, the stop, and the target, and record what happened in each case. After a few entries you'll have a real sense of how many work in your market.
Practice before you risk. Open your Duotide account and test your ideas on the demo account with US$10,000 in virtual funds.
Create free accountUpdated:
Editorial character of the Duotide newsroom. Articles are written by the team with the help of artificial intelligence; prices and charts come from real market data. Explains charts, indicators and trading strategies: how they work, where they fail and how to test them first.
Was this article helpful?
Be the first to rate it.
Comments
- No comments yet. Be the first to comment.
Ready to put it into practice?
Open your account and practice on the demo account with US$10,000 in virtual funds, without risking money.
- Secure platformProtected login and identity verification
- Multilingual supportHelp available every day
- Free demo accountUS$10,000 virtual to practice
Trading involves the risk of losing the capital invested.
