

 Português pt
 Español es
 العربية ar
 বাংলা bn
 Deutsch de
 Filipino fil
 Français fr
 हिन्दी hi
 Bahasa Indonesia id
 Italiano it
 Русский ru
 Svenska sv
 ไทย th
 Türkçe tr
 Tiếng Việt vi
 简体中文 zh
Updated:
Technical analysis4 reversal candlestick patterns: hammer to harami
 Naomi TanakaEditorial character · Analysis Desk

Quick answer
The four best-known reversal candlestick patterns are the hammer and the shooting star, made of a single candle with a long wick, and the engulfing and the harami, made of two candles. They indicate that the strength of the previous move has faded, but they only become a signal when they appear in a relevant region and are confirmed by the following candle. Even so, they fail often.
A single candle says little about what comes next, but some shapes appear often enough at turning points to deserve attention. Four of them show up on any chart, for any asset: the hammer, the engulfing pattern, the shooting star, and the harami.
In this guide, we show how to recognize each one and where they actually appeared on the Ibovespa's daily chart between February and October 2026, including one case where the signal didn't hold.
What a reversal candlestick pattern is
It's a shape made of one or two candles that suggests the strength of the previous move has faded. It's a clue, and it only carries weight when it appears in a relevant region of the chart, such as a support level, a resistance level, or the end of a long, stretched move.

How to recognize the 4 patterns
Hammer
Appears at the end of a decline. Small body at the top and a lower wick at least twice the size of the body. It shows that sellers pushed the price down, but buyers recovered almost all of it by the close.
Engulfing
Two candles of opposite colors, with the second candle's body covering the entire body of the first. The bullish engulfing appears after declines; the bearish one, after rallies. The larger the second candle relative to the first, the stronger the reading.
Shooting star
The mirror image of the hammer, at the top of a rally: small body at the bottom and a long upper wick. Buyers tried to push the price up, and sellers brought it back down near the open.
Harami
Also made of two candles, but the opposite of the engulfing pattern: the second one is small and contained within the body of the first, which is large. The name comes from Japanese and means pregnant. It shows that, after a strong candle, the market hesitated.
Real example: the 4 patterns on the Ibovespa in 2026
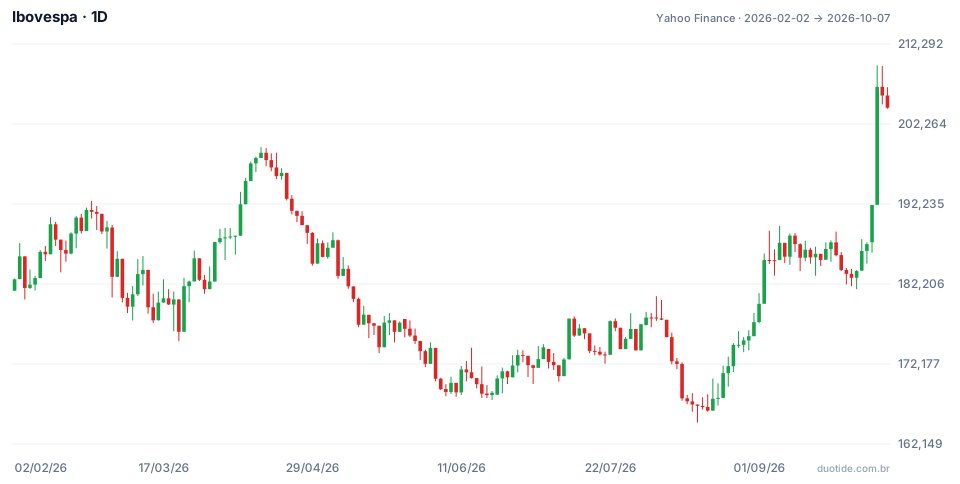
Over the chart's period, the Ibovespa went from 182,793 to 204,302 points, a gain of 11.77%, with a high of 209,606 on October 5 and a low of 164,835 on August 14.
Bearish engulfing on April 15
After rising 5.5% between the closes of April 7 and April 14, the index formed a bullish candle on April 14 (open 198,002, close 198,657). On April 15 it opened at 198,657 and closed at 197,738, below the previous day's open: a bearish engulfing. Ten sessions later, on April 30, it stood at 187,318, 5.3% lower.
Shooting star on August 4
On August 4 the index opened at 178,003, reached 180,680, and closed at 177,895: an upper wick of 2,677 points against a body of 108. Confirmation came on August 6, with a close of 175,546, below the star's low. On August 18 the index was at 166,335, 6.5% below the star's close.
Hammer on August 14
After that decline, the candle of August 14 opened at 167,100, fell to 164,835, the low for the whole period, and closed at 166,934: a lower wick of 2,099 points, more than 12 times the body. Confirmation didn't come the next day, but on August 19, when the index closed at 167,830, above the hammer's high. On August 28 it was at 175,665, 5.2% above the hammer's close.
Harami: one that failed and one that barely worked
On May 8, after a large bearish candle on May 7 (from 187,690 to 183,218), the index formed a small bullish candle contained within the previous one: a bullish harami. The next session, the index closed at 181,909, below the harami's low, and on May 22 it was at 176,210, 4.3% lower. The bearish harami on September 11, after a bullish candle on September 10, was followed by a modest decline: 2.0% over ten sessions. The examples show what happened, not what will happen.

How to use reversal patterns
Look in the right place
The four patterns carry more weight near levels that have already been tested and after long moves. The engulfing on April 15 came after ten straight sessions of gains; the hammer on August 14, after a 6.2% decline over eight sessions.
Wait for confirmation
The pattern only becomes a signal when the next candle, or one of the following ones, closes in the expected direction: below the star's low, above the hammer's high. For the hammer on August 14, confirmation took three sessions. For the harami on May 8, it never came; the opposite happened.
Use the pattern to place the stop
After a hammer, the stop goes below its low; after a shooting star or a bearish engulfing, above its high. The distance to the stop determines the position size.
Limitations
The harami is the weakest of the four, because it only shows hesitation. On indices like the Ibovespa, where the open tends to sit close to the previous close, engulfing and harami patterns appear more often and lose some of their meaning. And none of the four works every time.
Common mistakes when reading reversal candles
- Looking for the patterns in the middle of an already established trend, where they lose almost all their meaning.
- Trading before the candle closes: a long wick during the session can disappear by the close.
- Treating the harami as a reversal signal when it only shows indecision.
- Ignoring volume: an engulfing pattern with volume well above average carries more weight than the same shape on a quiet day.
- Entering without a defined stop or moving the stop when the pattern fails to confirm.
To practice, open the daily chart of the asset you follow on a demo account and mark the four patterns from the last few months. For each one, note whether there was confirmation, where the stop would have gone, and what the price did over the next ten sessions. With that record, you'll find out which patterns deserve attention on your asset and which ones are just noise.
Practice before you risk. Open your Duotide account and test your ideas on the demo account with US$10,000 in virtual funds.
Create free accountUpdated:
Editorial character of the Duotide newsroom. Articles are written by the team with the help of artificial intelligence; prices and charts come from real market data. Explains charts, indicators and trading strategies: how they work, where they fail and how to test them first.
Was this article helpful?
Be the first to rate it.
Comments
- No comments yet. Be the first to comment.
Ready to put it into practice?
Open your account and practice on the demo account with US$10,000 in virtual funds, without risking money.
- Secure platformProtected login and identity verification
- Multilingual supportHelp available every day
- Free demo accountUS$10,000 virtual to practice
Trading involves the risk of losing the capital invested.
