

 Português pt
 Español es
 العربية ar
 বাংলা bn
 Deutsch de
 Filipino fil
 Français fr
 हिन्दी hi
 Bahasa Indonesia id
 Italiano it
 Русский ru
 Svenska sv
 ไทย th
 Türkçe tr
 Tiếng Việt vi
 简体中文 zh
Updated:
Options5 tips to trade more efficiently with your time and capital
 Naomi TanakaEditorial character · Analysis Desk

Quick answer
To trade more efficiently, set the risk for each trade before opening the chart, adjust position size to volatility (the ATR helps with this), use alerts instead of watching the screen, set aside fixed blocks of time for analysis, and log every trade. These habits don't guarantee profit, but they prevent wasted attention and losses bigger than planned.
Anyone trading short-duration positions is competing for two resources at once: attention and capital. Every minute spent watching the chart without a clear criterion is tiring, and every trade opened without a risk rule eats into money you'll need later. None of the tips below is a secret; what makes the difference is applying them every day, the same way.
To keep this from being abstract, we used real daily EUR/USD quotes (Yahoo Finance) between April and October 2026, along with the ATR, a volatility indicator, to show how position size should change as the market changes.
1. Use alerts instead of staring at the chart
Mark the few levels that matter for your plan, such as a support, a resistance, or a round, widely watched number, and let the platform notify you when the price gets there. The time between one alert and the next is free for other things, and you avoid the trap of opening a trade just because you've been in front of the screen for an hour and feel like you need to do something.
On EUR/USD, the 1.1500 level was crossed three times at the daily close during the period: downward on June 18, 2026 (from 1.15073 to 1.14586), upward on July 30 (from 1.14672 to 1.15235), and downward again on September 16 (from 1.15376 to 1.14699). Three alerts in six months. Anyone who watched that level by staring at the chart all day would have spent hundreds of hours to see the same three events.

2. Set the risk before opening the chart
Decide how much you can lose per trade before you even see where the price is. When the limit is set with the chart in front of you, the urge to enter tends to stretch the number. A common rule is to risk between 0.5% and 2% of capital per trade. On a US$ 5,000 account, 1% means US$ 50: if the stop is hit, the loss is US$ 50, and nothing more than that.
3. Adjust position size to volatility
Fixed dollar risk doesn't mean fixed position size. If the market moves more, the stop needs to sit farther away so it isn't hit by normal noise, and then the position has to be smaller. The ATR (Average True Range) measures exactly how much the asset typically moves per candle.
How to calculate position size with the ATR
- Stop distance = 1.5 × daily ATR(14).
- Position size = dollar risk ÷ stop distance.
- On EUR/USD, every 0.0001 move (one pip) on 1,000 euros is worth US$ 0.10.

Real example: the EUR/USD's ATR in 2026
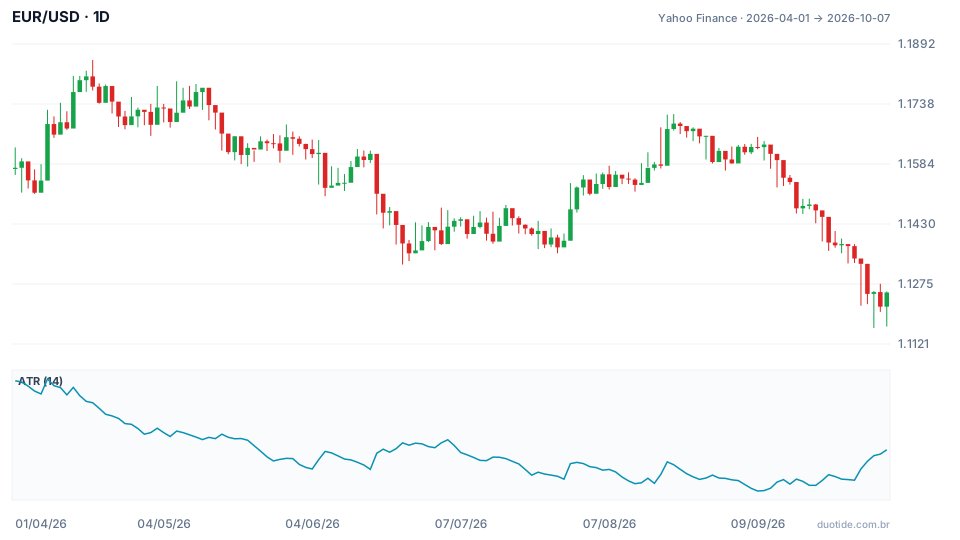
The chart shows EUR/USD from April 1, 2026 to October 6, 2026, with the 14-period ATR in the panel below. The pair started at 1.15906 and ended at 1.12535, a drop of 2.91%. More interesting than the direction is the change in volatility:
April: high volatility
On April 7, 2026 the ATR reached 0.00965, almost 97 pips a day, the highest value in the window. With the 1.5 × ATR rule, the stop would sit 0.01448 away from the entry price. To risk US$ 50, the position would be 50 ÷ 0.01448 = about 3,450 euros.
September: a calmer market
On September 8, 2026 the ATR dropped to 0.00473, about 47 pips, the lowest value in the period. Under the same rule, the stop would sit at 0.007095, and the position for the same US$ 50 risk would rise to 50 ÷ 0.007095 = about 7,050 euros, double April's.
October: volatility came back
In the last week of September the pair broke below the 1.13 level and the ATR rose again, reaching 0.00654 on October 6. The stop would be 0.00981 and the position, 50 ÷ 0.00981 = about 5,100 euros. Anyone who had kept September's size would have been risking far more than the planned US$ 50 without realizing it.
These numbers describe what happened; they don't indicate what EUR/USD will do going forward.
4. Group your analysis into time blocks
Checking the market every few minutes drains energy and rarely improves the decision. Set aside fixed blocks, for example 20 minutes in the morning and 20 in the afternoon, to review alerts, open positions, and the ATR of the assets you follow. Outside those blocks, the alerts do the work.
If the block runs over, push the decision to the next one instead of rushing. Skipping steps of your own checklist to make up for lost time is exactly when you get the stop or position size calculation wrong.
5. Test on demo and log everything
Every new idea, whether a different indicator or a tweak to the stop, should go through the demo account first. Testing on demo costs time; testing with real money costs money. Alongside the test, keep a simple log of every trade: date, asset, reason for the entry, stop distance, position size, result, and how long you spent analyzing it.
After a few weeks, the log reveals things memory hides: types of trades that take a lot of time and yield little, times of day when you make more mistakes, and days when position size didn't follow the rule.
How to put the five tips together in a trading day
Before the market opens
Set the maximum risk per trade and per day, check the ATR of the assets on your list, and set up alerts at the levels in your plan.
During the day
Open the chart when an alert fires or at the block's scheduled time. If there's an entry, position size comes straight from the risk ÷ stop-distance calculation, without deciding anything in the heat of the moment.
After the market closes
Log the trades, including the ones you chose not to make and why.
Limitations
The ATR looks backward: it measures the volatility of the last 14 sessions and can spike suddenly on a piece of news. In opening gaps, the price can jump past the stop, and the real loss exceeds what was planned. None of these tips eliminates the risk of loss; they just keep the risk at the size you chose.
Common mistakes when trying to save time and capital
- Using the same position size in calm and turbulent weeks, as if the ATR hadn't changed.
- Placing the stop closer than the ATR to fit a larger position.
- Setting alerts at so many levels that they turn into noise and you go back to watching the screen all day.
- Increasing risk after a losing streak to recover faster.
- Testing new ideas directly on the real account because demo feels like a waste of time.
- Leaving the log for the end of the week and filling it in from memory.
To practice, open EUR/USD or the asset you follow on a demo account, add the 14-period ATR, and for a few weeks calculate the position size for a fixed risk before every entry. Note the result of every trade: that log is what will show whether your process is actually saving time and capital.
Practice before you risk. Open your Duotide account and test your ideas on the demo account with US$10,000 in virtual funds.
Create free accountUpdated:
Editorial character of the Duotide newsroom. Articles are written by the team with the help of artificial intelligence; prices and charts come from real market data. Explains charts, indicators and trading strategies: how they work, where they fail and how to test them first.
Was this article helpful?
Be the first to rate it.
Comments
- No comments yet. Be the first to comment.
Ready to put it into practice?
Open your account and practice on the demo account with US$10,000 in virtual funds, without risking money.
- Secure platformProtected login and identity verification
- Multilingual supportHelp available every day
- Free demo accountUS$10,000 virtual to practice
Trading involves the risk of losing the capital invested.
