

 Português pt
 Español es
 العربية ar
 বাংলা bn
 Deutsch de
 Filipino fil
 Français fr
 हिन्दी hi
 Bahasa Indonesia id
 Italiano it
 Русский ru
 Svenska sv
 ไทย th
 Türkçe tr
 Tiếng Việt vi
 简体中文 zh
Updated:
OptionsDigital Options: How They Work and How to Calculate the Risk
 Naomi TanakaEditorial character · Analysis Desk

Quick answer
A digital option pays a fixed amount if the asset's price ends above (or below) a chosen level, the strike, at the expiry time, and pays nothing if the condition fails. Strikes farther from the current price pay more because they happen less often. The math that decides whether it's worth it is comparing the win rate needed to break even, 1 ÷ (1 + payout), with the actual frequency the price reaches the strike.
Digital options are close relatives of binary options, with one practical difference: you can usually choose the strike, closer to or farther from the current price, and the offered payout changes depending on that choice. This gives more control, but also more ways to get the math wrong.
To show how strike, expiry, and payout relate to each other, we used real daily USD/JPY (dollar against yen) quotes between April and October 2026 and measured how often the price reached strikes at different distances, using the ATR, the average daily range, as a ruler.
How Digital Options Work
The contract has four choices: the asset, the direction (above or below), the strike, and the expiry. At expiry, if the condition was met, you receive the amount invested plus the agreed payout; if not, you lose the amount invested. The distance between the final price and the strike doesn't matter.
Strike Close or Far
With the strike at the current price, the win rate sits close to half and the payout is smaller. With the strike far away, the win rate drops and the payout rises. Neither choice is better by itself: what matters is whether the payout compensates for the probability.

How to Calculate the Risk of a Digital Option
- Break-even rate = 1 ÷ (1 + r), where r is the payout as a fraction of the amount invested.
- 80% payout: 1 ÷ 1.80 = 55.6% win rate to break even.
- 200% payout: 1 ÷ 3 = 33.3%.
- 400% payout: 1 ÷ 5 = 20.0%.
- Expectancy per trade = (win rate × payout) − (loss rate × amount invested).
Example: R$ 50 per trade, 80% payout. If you're right, you make R$ 40; if you're wrong, you lose R$ 50. With a 52% win rate, the expectancy is 0.52 × 40 − 0.48 × 50 = R$ 20.80 − R$ 24.00 = −R$ 3.20 per trade.
Real Example: Strikes and Expiries on USD/JPY
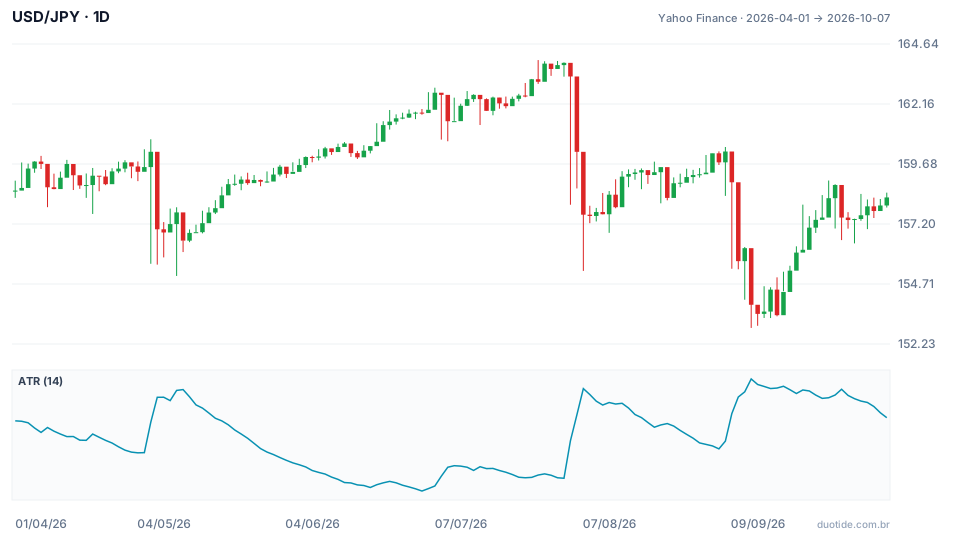
USD/JPY opened the window at 158.579 on April 1, 2026 and closed on October 7 at 158.296, almost in the same place. Along the way it hit a high of 163.98 on July 23 and a low of 152.90 on September 8. The 14-day ATR, in the lower panel, ranged from 0.526 yen (June 29) to 1.639 (September 8) and stood at 1.255 on October 7.
One-Day Expiry
For each of the 135 days in the window, we checked whether the next close was above that day's close plus a distance measured in ATR:
- Strike at the day's price: condition met on 89 of 135 days, 65.9%.
- Strike 0.25 ATR above: 46 days, 34.1%.
- Strike 0.5 ATR above: 19 days, 14.1%.
- Strike 1 ATR above: 4 days, 3.0%.
With a one-day expiry, a strike 1 ATR away was almost never reached. A 400% payout requires a 20% win rate, and the observed frequency was 3%. A strike at 0.5 ATR, with a 200% payout, would require 33.3%, and the frequency was 14.1%: in both cases, anyone who always bought these digitals would have lost money over the period.
Five-Day Expiry
Repeating the math with a five-trading-day expiry (131 observations): strike at the price, 67.2%; at 0.25 ATR, 51.9%; at 0.5 ATR, 42.7%; at 1 ATR, 23.7%. More time gives the price more room to move, and the frequency of distant strikes rises considerably.
Why These Numbers Don't Repeat
The pair rose on 65.9% of days but ended the window practically unchanged. This happened because the gains were small and some drops were large: from September 2 to September 8 the close fell from 160.196 to 153.855, a 4.0% pullback in four trading days. And the proportion changes from one period to another: from April to September 2025, the same pair closed higher on only 43.0% of days (55 of 128). A frequency measured over one period describes that period, not the next one.

How to Use This Math Before Trading
Measure the Strike Distance in ATR
Saying the strike is 50 points away says nothing; saying it's half an ATR away, with the expiry you chose, lets you compare it with the asset's history.
Compare the Frequency with the Break-Even Rate
If the offered payout requires a 33% win rate and the historical frequency is 14%, the trade has negative expectancy before any analysis.
Set the Size of Each Trade
Since each contract can lose 100% of the amount invested, use a small fraction of your capital per trade, 1% to 2%, so a losing streak doesn't put the account at risk.
Limitations
The tests use daily closes; on minute-level expiries the behavior is different and noise weighs more. The offered payout changes with the asset, the time of day, and volatility. And past data doesn't guarantee future frequencies, as the comparison between 2025 and 2026 shows.
Common Mistakes with Digital Options
- Choosing the strike for the highest payout without estimating the chance of it being reached.
- Using the same strike distance on calm and volatile days, without adjusting for the ATR.
- Drawing conclusions from a frequency measured in a single period.
- Increasing the stake after a loss to try to recover it.
- Trading very short expiries, where the result depends almost entirely on noise.
To practice, use a demo account and log each trade with the asset, strike, distance in ATR, expiry, offered payout, and result. After a few dozen trades, compare your win rate in each distance range with the break-even rate. The spreadsheet shows where, if anywhere, the math works out.
Practice before you risk. Open your Duotide account and test your ideas on the demo account with US$10,000 in virtual funds.
Create free accountUpdated:
Editorial character of the Duotide newsroom. Articles are written by the team with the help of artificial intelligence; prices and charts come from real market data. Explains charts, indicators and trading strategies: how they work, where they fail and how to test them first.
Was this article helpful?
Be the first to rate it.
Comments
- No comments yet. Be the first to comment.
Ready to put it into practice?
Open your account and practice on the demo account with US$10,000 in virtual funds, without risking money.
- Secure platformProtected login and identity verification
- Multilingual supportHelp available every day
- Free demo accountUS$10,000 virtual to practice
Trading involves the risk of losing the capital invested.
