

 Português pt
 Español es
 العربية ar
 বাংলা bn
 Deutsch de
 Filipino fil
 Français fr
 हिन्दी hi
 Bahasa Indonesia id
 Italiano it
 Русский ru
 Svenska sv
 ไทย th
 Türkçe tr
 Tiếng Việt vi
 简体中文 zh
Updated:
ForexBest Indicators for Trading Forex: Moving Averages, RSI, MACD, and Bollinger
 Naomi TanakaEditorial character · Analysis Desk

Quick answer
The most used indicators for trading forex are moving averages (trend), the RSI (momentum), the MACD (trend and momentum), and Bollinger Bands (volatility). The best combination uses one indicator per question, for example the 50-period average, the RSI, and Bollinger, instead of several that say the same thing. None of them predicts price: they're all calculations based on past prices.
Anyone starting to study the foreign exchange market runs into dozens of indicators on charting platforms. The problem is rarely a lack of tools, but an excess of them: stacking similar indicators just repeats the same information under different names and slows down the decision.
In this guide you'll see the four most used indicators in forex, what each one measures, and how to combine them without duplicating the reading. The examples use real daily prices for GBP/USD from April to October 2026.
What each indicator measures
Moving averages: trend
The 50-period simple moving average adds up the last 50 closes and divides by 50. Price above it signals a bullish bias; below it, a bearish one. Averages show the overall direction well, but they lag, because they only look backward.
RSI: momentum
The relative strength index ranges from 0 to 100 and compares the average gain with the average loss over the last 14 periods. Above 70 signals overbought; below 30, oversold. In a strong trend, it can sit in those zones for days without the price reversing.
MACD: trend and momentum together
The MACD is the difference between the 12- and 26-period exponential averages, with a 9-period signal line. The MACD line crossing above the signal indicates buying momentum; crossing below, selling momentum. Since it's already built from averages, using the MACD and two moving averages for the same function is redundant: pick one.
Bollinger Bands: volatility
The bands are a 20-period average with two lines sitting two standard deviations away. When volatility drops, they narrow; when it rises, they widen. Narrow bands warn that a bigger move may be coming, but they don't say which way.

How to calculate the width of Bollinger Bands
On May 11, 2026, GBP/USD's 20-day average stood at 1.3539, the upper band at 1.3616, and the lower at 1.3461. The math is straightforward:
- Distance from the average to each band: 1.3616 − 1.3539 = 0.0077, or 77 pips. That figure is two standard deviations, so one deviation is about 38 pips.
- Total width: 1.3616 − 1.3461 = 0.0155, or 155 pips.
- On April 24, the width had reached 533 pips. In just over two weeks, the bands shrank to less than a third of that.
The 155 pips on May 11 were the narrowest width of the entire period analyzed.
Real example: GBP/USD in 2026
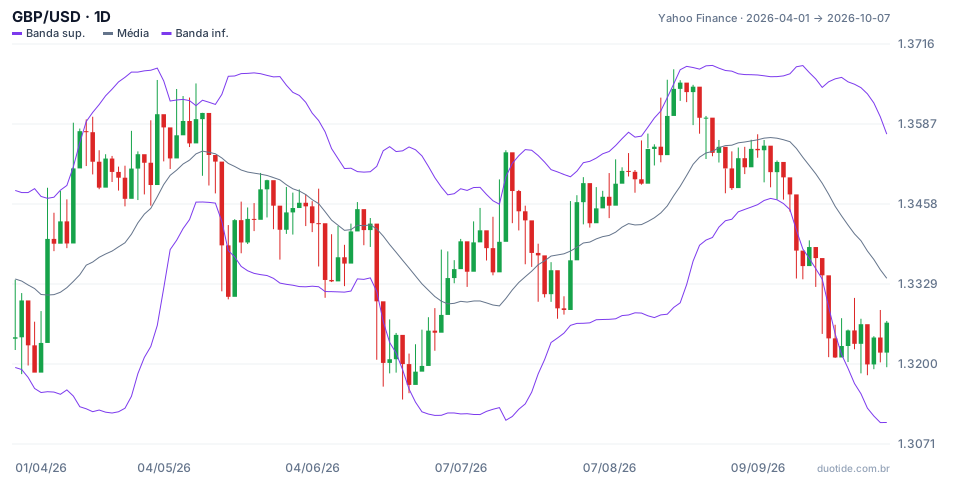
The chart shows GBP/USD from April 1 to October 7, 2026 with Bollinger Bands (20, 2). The pair started at 1.3243 and ended at 1.3267, practically in the same spot, but along the way it went from a low of 1.3143 on June 24 to a high of 1.3675 on August 21. Three moments show how the indicators complement each other.
May: a squeeze followed by a fast drop
After the 155-pip width on May 11, the pair closed below the lower band on May 15, at 1.3391 (the band was at 1.3430), and fell to 1.3308 on May 18. The width jumped to 323 pips on May 22. The move, though, didn't last: by May 19 the pair was already back at 1.3432. The squeeze warned of the move; it didn't say how big it would be.
August: the RSI near 70 without getting there
On August 24, the RSI marked 69.6 with the pair at 1.3654, near the period's high. The indicator never even crossed 70, but it was already showing an overextended move. On September 3, GBP/USD was at 1.3484, about 170 pips lower. Anyone waiting for the RSI to pass 70 to act would have been waiting for a signal that never came.
September: oversold in a downtrend
The band width fell to 196 pips on September 11. On September 17, the pair closed at 1.3383, below the lower band (1.3416), and kept falling. On September 24, the RSI was at 26.3, with the price at 1.3242 and below the 50-day average (1.3477). Anyone buying on the oversold reading saw the RSI fall even further, to 24.6 on September 25, and the pair spend the following two weeks between 1.32 and 1.33, closing October 7 at 1.3267. Below the 50-day average, oversold wasn't a sign of a turn.

How to combine indicators in forex
One indicator per question
A lean combination uses the 50-period average for direction, the RSI to check whether the move is overextended, and Bollinger Bands to assess volatility. The MACD can replace the average, but it shouldn't be added alongside it for the same function.
Read in the right order
Trend first, then momentum, and volatility and the stop last. In September, the 50-day average already showed the pair was in a downtrend before the RSI even hit oversold.
Turn volatility into risk
On October 7, GBP/USD's 14-day ATR was about 72 pips. A 1.5 ATR stop comes to 108 pips. On a micro lot (10,000 pounds), each pip is worth about $1, so the risk would be roughly $108 per micro lot. If that figure is bigger than your per-trade limit, the fix is to shrink the position, not tighten the stop.
Limitations
All of these indicators are calculated from past price. They don't anticipate central bank decisions or economic data, which in forex move the price within seconds. And what worked on GBP/USD in 2026 may not repeat on another pair or in another period.
Common mistakes with forex indicators
- Using the MACD and two moving averages together for the same function, as if they were three confirmations.
- Buying just because the RSI is below 30, without checking whether the price is below the long-term average.
- Treating narrow bands as a direction signal: they only indicate that volatility is low.
- Waiting for an exact number (70, 30) and ignoring what the indicator is already showing before it gets there.
- Tightening the stop to fit the risk instead of shrinking the position size.
- Forgetting that the examples above describe what happened, not what will happen.
To practice without risking money, set up the combination of the 50-period average, the RSI, and Bollinger Bands on a demo account, pick one or two pairs, and record every signal over a few weeks: date, price, each indicator's reading, and what happened afterward. This log quickly shows which readings make sense for the pair you trade.
Practice before you risk. Open your Duotide account and test your ideas on the demo account with US$10,000 in virtual funds.
Create free accountUpdated:
Editorial character of the Duotide newsroom. Articles are written by the team with the help of artificial intelligence; prices and charts come from real market data. Explains charts, indicators and trading strategies: how they work, where they fail and how to test them first.
Was this article helpful?
Be the first to rate it.
Comments
- No comments yet. Be the first to comment.
Ready to put it into practice?
Open your account and practice on the demo account with US$10,000 in virtual funds, without risking money.
- Secure platformProtected login and identity verification
- Multilingual supportHelp available every day
- Free demo accountUS$10,000 virtual to practice
Trading involves the risk of losing the capital invested.
