

 Português pt
 Español es
 العربية ar
 বাংলা bn
 Deutsch de
 Filipino fil
 Français fr
 हिन्दी hi
 Bahasa Indonesia id
 Italiano it
 Русский ru
 Svenska sv
 ไทย th
 Türkçe tr
 Tiếng Việt vi
 简体中文 zh
Updated:
ForexMost Traded Forex Pairs: Characteristics and Volatility of Each One
 Naomi TanakaEditorial character · Analysis Desk

Quick answer
The most traded forex pairs are EUR/USD, USD/JPY, GBP/USD, AUD/USD, and USD/CAD, all with the US dollar on one side. They concentrate the currency market's largest liquidity, but they don't move the same way: between April and October 2026, the average daily range was 0.34% for USD/CAD and 0.61% for AUD/USD. Knowing that difference helps you choose when to trade and calibrate your position size.
The foreign exchange market brings together more than 180 currencies, but most of the daily volume concentrates in a handful of pairs. For anyone starting out, picking two or three of them and getting to know them well pays off more than trying to follow dozens of combinations at once.
In this guide, besides each pair's well-known characteristics, we use real daily Yahoo Finance quotes between April 1, 2026 and October 7, 2026 to measure how much each one actually moved. The numbers describe that period; they change over time and don't indicate what's going to happen.
What Sets One Pair Apart from Another
Three characteristics change from one pair to another and directly affect how you trade:
- Liquidity: how much money flows through the pair. More liquidity usually means a smaller spread, that is, a lower cost per trade.
- Volatility: how much the price usually moves in a day. It sets the stop's distance and, therefore, the position size.
- Trading hours: each currency moves more when its market is open. The Sydney, Tokyo, London, and New York sessions take turns throughout the 24 hours of the trading day.

How to Measure a Pair's Volatility
The most used measure is the ATR (average true range), which calculates the average daily range over the last 14 days, including opening gaps. In forex, the ATR is usually read in pips: for EUR/USD, a pip is 0.0001; for pairs with the yen, 0.01.
Since the pairs have very different prices, it's also worth looking at the range as a percentage: (high − low) ÷ close. The average of that calculation over the period was:
- AUD/USD: 0.61% per day
- USD/JPY: 0.53% per day
- GBP/USD: 0.47% per day
- EUR/USD: 0.43% per day
- USD/CAD: 0.34% per day
EUR/USD: The Most Traded Pair
The euro against the dollar concentrates the largest slice of global forex volume, because it links the two biggest Western economies and is used constantly by banks, funds, and companies. That liquidity usually translates into the lowest spread among the pairs.
In the period analyzed, EUR/USD went from 1.15742 on April 1 to 1.12535 on October 7, a 2.77% drop. The high was 1.18511 on April 17 and the low, 1.11623 on October 5. The 14-day ATR ended at 65 pips; the highest value was 97 pips, on April 8, and the lowest, 47 pips, on September 9. The move usually gains strength during the London and New York overlap, in the early afternoon Brasília time, and reacts strongly to European Central Bank and Federal Reserve decisions.

USD/JPY: Interest Rates and Risk Aversion
The yen is seen by many investors as a safe-haven currency, and the interest rate gap between the United States and Japan weighs heavily on this pair. The highest activity happens during the Asian session and again when New York opens.
Between April and October, USD/JPY swung between the high of 163.979 on July 23 and the low of 152.897 on September 8, and ended practically where it started: 158.579 on April 1 and 158.296 on October 7. The sharpest day was September 4, when the pair fell 2.05% (from 158.923 to 155.660). That drove the ATR up to 1.639 yen (164 pips) on September 8, more than triple the window's lowest value, 0.526 yen on June 29.
GBP/USD: Volatility Above the Euro on Average
The pound against the dollar, nicknamed cable, tends to swing more than EUR/USD over short time frames. Bank of England decisions, British inflation data, and political events in the UK can trigger fast moves.
Real Example: GBP/USD's Volatility in 2026
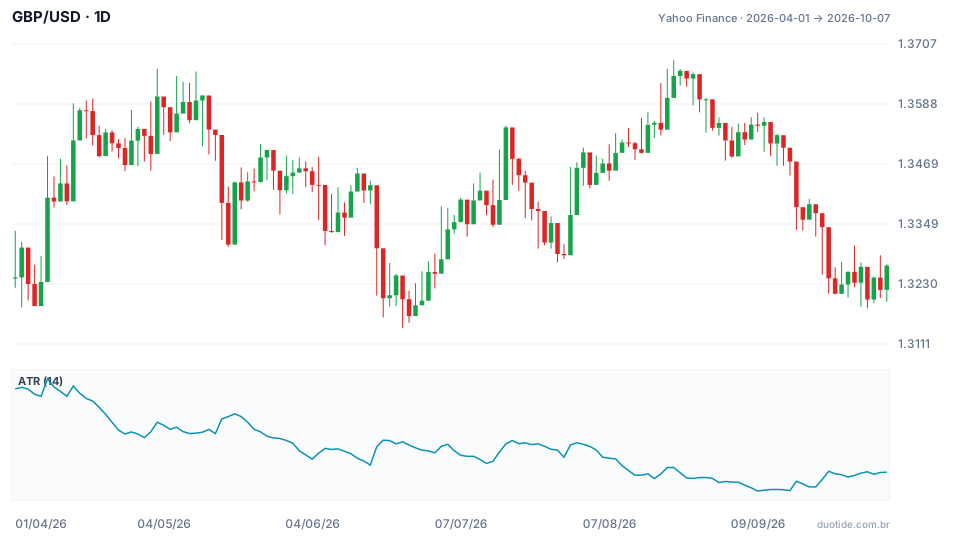
The chart shows the GBP/USD price and, below it, the 14-day ATR. Three moments help illustrate what the indicator measures:
April: The Volatility Peak
On April 8 the pair rose 1.27%, from 1.32342 to 1.34018. That same day EUR/USD rose 1.26%: it was a dollar move, not a pound one. GBP/USD's ATR reached 124 pips, the window's highest value. Anyone using a fixed 50-pip stop that week had a stop smaller than half of a single day's average swing.
September: The Calm
On September 9 the ATR fell to 62 pips, half of April's peak. On that same date EUR/USD marked its lowest ATR of the period, 47 pips. With lower volatility, the same dollar risk allows for a larger position; the caveat is to reduce the size once the ATR starts rising again.
October: What the Current Numbers Show
On October 7, GBP/USD closed at 1.32668, almost the same level as April's (1.32433), with an ATR of 72 pips, or 0.54% of the price. Curiously, EUR/USD's ATR on that same date equaled 0.58% of its price: the reputation of being the more volatile pair is a long-term average, not an everyday rule. The period's high was 1.36750 on August 21 and the low, 1.31430 on June 24.
AUD/USD and USD/CAD: The Commodity Currencies
The Australian dollar is usually associated with iron ore and the Chinese economy, Australia's main trading partner. It was the most agitated pair on the list, with an average range of 0.61% a day; the ATR ended at 50 pips, with a quote of 0.69818 on October 7.
The Canadian dollar is traditionally linked to oil, because Canada is a major exporter. But the relationship isn't automatic: over the period, the correlation between USD/CAD's daily changes and WTI oil was 0.05, that is, practically none. USD/CAD was the calmest of the five, with an average range of 0.34% and an ATR of 63 pips on October 7, when it closed at 1.42122.
How to Use These Characteristics
Choose the Hours by the Pair
Trading EUR/USD or GBP/USD in the early hours of the morning in Brasília usually means less volume and a wider spread. For USD/JPY and AUD/USD, the Asian session carries more weight. Focus your study on the hours when your pair actually moves.
Calculate the Position by the ATR
With a $10,000 account and 1% risk per trade ($100), a stop of 1.5 times the October 7 ATR comes to 108 pips on GBP/USD (1.5 × 72). Since a pip of a standard lot on this pair is worth $10, the position is 100 ÷ (108 × 10) = 0.09 lots. On EUR/USD, with a 98-pip stop (1.5 × 65), the position would be 0.10 lots. The dollar risk stays the same; what changes is the size.
Follow Each Currency's Calendar
Interest rate, inflation, and employment decisions move the pairs differently. The yen pair tends to react to Bank of Japan signals; the pound pair, to the Bank of England.
Limitations
The ATR measures the size of the move, not the direction. Correlations with commodities, as USD/CAD showed, can disappear for months. And six months of numbers describe a specific period: a pair's volatility changes along with the interest rate cycle and the news.
Common Mistakes When Choosing Forex Pairs
- Using the same stop in pips for all pairs, without looking at each one's volatility.
- Trading several dollar pairs at once thinking it's diversification: on April 8, EUR/USD and GBP/USD rose together by more than 1.2%.
- Relying on classic correlations, like oil and the Canadian dollar, without checking whether they hold in the current period.
- Trading outside the pair's peak liquidity hours and paying a wider spread without realizing it.
- Treating a pair's reputation as a fixed rule: relative volatility changes from one month to the next.
To practice, pick two of these pairs in your demo account, note each one's ATR every week, and calculate the position size before each trade. Logging those numbers for a few months shows, with your own data, how each pair behaves.
Practice before you risk. Open your Duotide account and test your ideas on the demo account with US$10,000 in virtual funds.
Create free accountUpdated:
Editorial character of the Duotide newsroom. Articles are written by the team with the help of artificial intelligence; prices and charts come from real market data. Explains charts, indicators and trading strategies: how they work, where they fail and how to test them first.
Was this article helpful?
Be the first to rate it.
Comments
- No comments yet. Be the first to comment.
Ready to put it into practice?
Open your account and practice on the demo account with US$10,000 in virtual funds, without risking money.
- Secure platformProtected login and identity verification
- Multilingual supportHelp available every day
- Free demo accountUS$10,000 virtual to practice
Trading involves the risk of losing the capital invested.
