

 Português pt
 Español es
 العربية ar
 বাংলা bn
 Deutsch de
 Filipino fil
 Français fr
 हिन्दी hi
 Bahasa Indonesia id
 Italiano it
 Русский ru
 Svenska sv
 ไทย th
 Türkçe tr
 Tiếng Việt vi
 简体中文 zh
Updated:
StocksBig Tech Earnings Season: Why It Moves the Market
 Rafael AzevedoEditorial character · Markets Desk

Quick answer
Big tech earnings season moves the market because these companies carry enormous weight in market-cap-weighted indexes, like the S&P 500 and the Nasdaq. What drives the price is the result relative to expectations and the outlook for the coming quarters. On July 30, 2026, for example, Microsoft rose 15.5% in a single day, almost ten times its average daily move in the period.
Four times a year, a handful of tech companies release their quarterly results, and for a few days the whole market pays attention. That's not an exaggeration: these companies carry so much weight in the major stock indexes that each one's result tends to drag the mood of thousands of other assets along with it, even outside the sector.
In this guide we use real daily quotes from Microsoft, the Nasdaq, and other big techs between April and October 2026 to show how large the moves in these weeks can get and how to handle them.
What earnings season is
Publicly traded companies in the United States release results every quarter. Big techs usually report their numbers a few weeks after each quarter ends, which bunches the reports up in late January, April, July, and October. The dates are announced ahead of time and are posted on each company's investor relations page.
Why a handful of companies move the whole index
Broad indexes, such as the S&P 500 and the Nasdaq, are weighted by market value. Giant companies carry a proportionally bigger weight in the calculation: when one of them rises or falls sharply, the index moves with it, even if most other companies haven't reported anything that day.
There's also a sentiment effect. If the sector's most representative company disappoints, investors revise their expectations for the rest, and the selling spreads even to stocks that haven't reported yet.

What investors look at in every earnings report
- Revenue and earnings per share compared with market expectations, not just with the previous quarter.
- Margins, which show whether the company is controlling costs while growing.
- Guidance, the company's own projection for the coming quarters, which often weighs more on the price than the result already published.
- Investments in processing capacity, artificial intelligence, and new areas, which signal where the company is betting on future growth.
Why the price can fall even with record profit
A stock's price already bakes in expectations before the earnings report comes out. If the market expected 20% revenue growth and the company delivers 15%, the result is positive, but it falls short of what was priced in, and the stock can drop. What moves the price is the gap between the result and the expectation.
Real example: Microsoft in July 2026
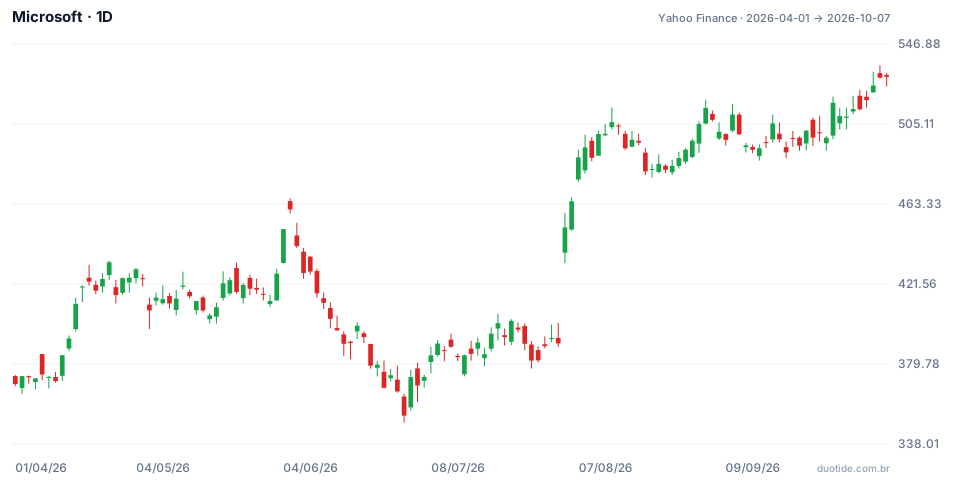
The chart shows Microsoft's (MSFT) daily candles from April to October 2026. The stock started the period at $369.37, made its low on June 25 ($349.20), and ended on October 7 at $529.76, up 43.4% over the window. Much of that path happened in just a few days at the end of July, the time when the company usually reports results for the quarter ended in June. We haven't checked the exact timing of each release here; the numbers below are just what the price did.
The July 30 jump
On July 29, MSFT closed at $390.54. The next day it opened at $437.90, a 12.1% gap, and closed at $451.10, up 15.5% on the day. For comparison, the stock's average daily move over the period was 1.59%: the July 30 move was equal to almost ten normal days. Volume was 110.2 million shares, against 47.2 million the day before.
What came next
The move didn't unwind in the days that followed. The stock closed at $464.72 on July 31, $487.65 on August 3, and $506.06 on August 10, 29.6% above the July 29 close. It isn't always like this: there are seasons when the initial jump gets given back within a few sessions.
Big techs moving in opposite directions on the same day
Also on July 30, Meta fell 7.95%, from $585.61 to $539.03. The next day, July 31, Amazon rose 15.3% (from $235.50 to $271.58) while Apple fell 7.35% (from $333.43 to $308.91). The Nasdaq, which adds all of them up, rose 2.78% on July 30: the index shows the net result and hides much bigger individual moves. The pattern repeated in April: on April 30, Alphabet rose 9.96% and Meta fell 8.55%.

How to follow earnings season
Build the calendar in advance
Write down the report dates for the companies that carry weight in the index or in the asset you trade. Many report after the market closes, and the reaction shows up as a gap at the next open, as in Microsoft's case.
Cut your position size
If the average move is 1.6% a day and earnings day can bring 15%, a stop calibrated for normal days stops protecting you. Those who decide to hold a position through the report usually cut the size so that an adverse gap doesn't exceed the planned risk.
Wait for the first reaction
Watching the first few hours after the report helps separate an overreaction, which corrects within a few days, from the start of a longer-lasting change. There's no fixed rule: in July 2026 MSFT kept rising; in other quarters, the jump was given back.
Watch the effect on other markets
Big tech results work as a thermometer for risk appetite. A weak season tends to weigh on broad indexes, risk-linked currencies, and even commodities; a strong season spreads optimism. That's why traders in other markets tend to follow this window too.
Limitations
The price reacts to factors the earnings report doesn't capture on its own: interest rates, sector news, positions big investors have already built. Reading the result and getting the stock's direction right are different things, and this text doesn't recommend buying or selling any stock.
Common mistakes during earnings season
- Assuming higher profit always means the stock rises, without comparing it to expectations.
- Holding a normal-sized position through the report, with a stop designed for ordinary days.
- Forgetting that a stop doesn't protect against a gap: the order gets filled at the first available price.
- Reading only the index and ignoring that each big tech can move in a different direction.
- Treating one quarter's move as the pattern for the next: the examples above describe what happened, not what will happen.
To practice without risking money, use a demo account next season: write down the report date, the previous close, the opening gap, and the price five sessions later for each company you follow. After a few seasons, your record will show the real size of the risk on those days.
Practice before you risk. Open your Duotide account and test your ideas on the demo account with US$10,000 in virtual funds.
Create free accountUpdated:
Editorial character of the Duotide newsroom. Articles are written by the team with the help of artificial intelligence; prices and charts come from real market data. Follows the news that moves prices — rates, stock markets, companies and commodities — explained without jargon.
Was this article helpful?
Be the first to rate it.
Comments
- No comments yet. Be the first to comment.
Ready to put it into practice?
Open your account and practice on the demo account with US$10,000 in virtual funds, without risking money.
- Secure platformProtected login and identity verification
- Multilingual supportHelp available every day
- Free demo accountUS$10,000 virtual to practice
Trading involves the risk of losing the capital invested.
