

 Português pt
 Español es
 العربية ar
 বাংলা bn
 Deutsch de
 Filipino fil
 Français fr
 हिन्दी hi
 Bahasa Indonesia id
 Italiano it
 Русский ru
 Svenska sv
 ไทย th
 Türkçe tr
 Tiếng Việt vi
 简体中文 zh
Updated:
StocksWhy Is Nike Stock Down? The S&P 100 Removal Explained
 Rafael AzevedoEditorial character · Markets Desk

Quick answer
Nike was removed from the S&P 100 on September 21, 2026, but the index exit explains little of the decline. The stock was already about 78% below its all-time high before the announcement, because of its dependence on a few sneaker models, falling direct sales and sales in China, and a profit that dropped far more than revenue. The index removal weighs on the short term, when funds rebalance their portfolios, but it doesn't change the company's business.
When a well-known stock falls a lot, a single news item often shows up trying to explain everything at once. For Nike, that news item was its removal from the S&P 100 index, announced by S&P Dow Jones Indices on September 4, 2026, effective September 21. The company remained in the S&P 500.
The problem is that an index exit doesn't explain years of decline. According to a Bloomberg Línea report from September 7, 2026, the shares were about 78% below their all-time high at the start of that month. The price confirms it: the closing record in Yahoo Finance data is $177.51, on November 5, 2021, and on September 2, 2026, the stock closed at $38.24, 78.5% lower. The reasons show up in the company's own results.
What the S&P 100 Is and Why the Exit Matters
The S&P 100 brings together about 100 large American companies chosen from within the S&P 500, based on size, liquidity, and sector representation. When a company loses market value relative to the others, it can be replaced.
The removal forces funds that track the index to sell the stock on the change date. It's a technical flow, concentrated in a few days, that says nothing about sales, margins, or profit. That's why it usually affects short-term volume and price more than the trend.

Real Example: Nike Stock in 2026
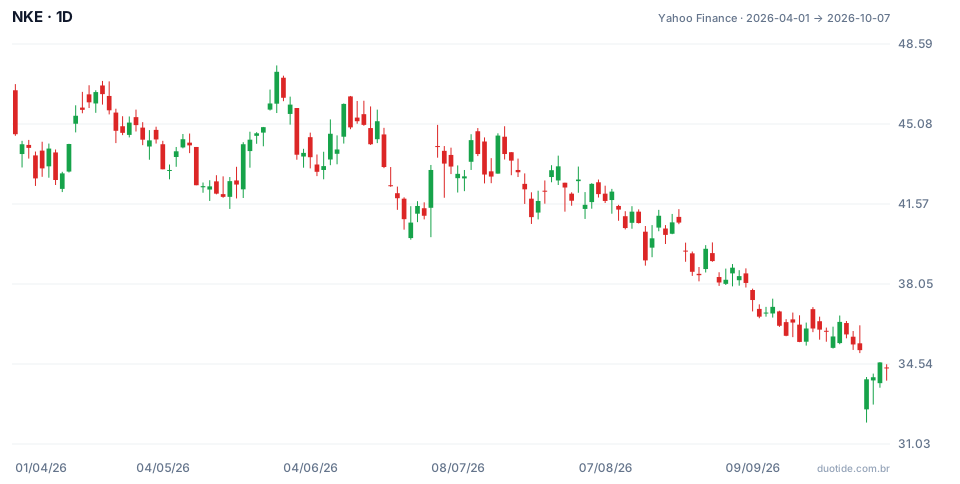
The chart shows Nike's daily price between April 1 and October 7, 2026. The stock went from $44.63, reached a high of $47.65 on May 28, and fell to a low of $31.97 on October 2, closing on October 7 at $34.36, a 23% drop over the period. Since 2025's last trading day ($63.71), the decline is 46.1%. Three moments help separate the index's effect from the rest:
From the Announcement to the Change Date
On the announcement day, September 4, the stock closed at $38.40. By September 18, the last trading day before the change, it had fallen 7.5%, to $35.51. On that day volume was 52.1 million shares, about 1.8 times the period's daily average (28.6 million), the typical pattern of funds adjusting their portfolios on the eve of a rebalancing.
After the Exit
On September 21, the first day out of the index, the stock closed at $36.10, above the previous trading day. By October 7 it had pulled back 4.8%. The forced selling flow passed, and the downtrend continued anyway.
The Biggest Volumes Came Afterward
The two highest-volume trading days of the period weren't linked to the index change: October 1, with 112.4 million shares, and October 2, with 142.7 million, when the stock opened at $32.55, well below the previous day's $35.15, and marked the window's low. The market reacts more strongly to information about the business than to an index swap.
The Underlying Reasons for the Decline
Dependence on a Few Sneaker Models
When explaining fiscal year 2025's third quarter, management acknowledged it had relied too much on classic lines, like the Air Force 1, Dunk, and Air Jordan 1, and said it would cut back the supply of those models, without discontinuing them, to make room for new products. The transition is painful: selling less of an established sneaker cuts revenue immediately, while the new launch still has to prove it can sustain a similar volume.
Rebuilding Without Relying on Discounts
Fiscal year 2026's annual report describes two fronts at once: rebuilding wholesale distribution and turning the digital channel into full-price selling. Clearing stuck inventory required discounts and returns in some areas. In the fiscal year ended May 31, 2026, in reported figures:
- Wholesale sales: up 6%.
- Nike Direct sales (own stores and digital): down 6%.
- Greater China: down 11%, with less store traffic, heavy promotions, and excess inventory.
- Converse: down 31%.
Selling more to the retailer isn't the same as the retailer selling more to the consumer: real demand still has to be confirmed at the register.
Profit Fell More Than Revenue
In fiscal year 2025, revenue fell 10%, but diluted earnings per share fell 42%, more than four times as much. The gross margin pulled back with discounts and inventory costs. Rent, staff, and marketing don't fall at the same pace as sales, and the bottom line suffers disproportionately. In fiscal year 2026, revenue stayed practically flat, and diluted earnings per share fell again, from $2.16 to $2.10.
The Margin That Needs Context
In fiscal year 2026's fourth quarter, the gross margin was 49.2%. About nine percentage points came from the expected recovery of tariffs paid under a specific American trade law, the IEEPA. Without that effect, the margin is close to 40.2%, practically the same as the 40.3% of the same quarter the year before: stable, not better.

How to Analyze a Stock's Decline
Separate Technical Events from Fundamentals
Index exits, options expirations, and rebalancings generate buying or selling flows that tend to pass within a few days. Changes in revenue, margin, and profit affect the trend for quarters.
Look at the Series of Results, Not One Quarter
A single number, like a 49.2% margin, can mislead. Comparing it with the same period the year before and stripping out one-off effects shows the real picture.
Use Volume as a Clue
Volume well above average on a known date, like the eve of an index change, suggests a technical flow. Volume spikes on dates with no technical event usually indicate new information about the company.
Limitations
None of this indicates where the stock is headed. The numbers above describe what happened and aren't a recommendation to buy or sell.
Common Mistakes When Interpreting a Stock's Decline
- Blaming the entire decline on the most recent news, like the S&P 100 exit, while ignoring years of results.
- Thinking a stock that fell 78% is cheap just because of the drop, without looking at profit and prospects.
- Celebrating a high margin without stripping out one-off effects, like a tariff recovery.
- Confusing wholesale sales with end-consumer demand.
- Ignoring volume, which helps distinguish a technical flow from a reaction to new information.
To practice, pick a stock you follow, mark the earnings dates and technical events on your demo account chart, and note the volume and price change for each one. After a few quarters, your record will show which news items actually changed the trend.
Practice before you risk. Open your Duotide account and test your ideas on the demo account with US$10,000 in virtual funds.
Create free accountUpdated:
Editorial character of the Duotide newsroom. Articles are written by the team with the help of artificial intelligence; prices and charts come from real market data. Follows the news that moves prices — rates, stock markets, companies and commodities — explained without jargon.
Was this article helpful?
Be the first to rate it.
Comments
- No comments yet. Be the first to comment.
Ready to put it into practice?
Open your account and practice on the demo account with US$10,000 in virtual funds, without risking money.
- Secure platformProtected login and identity verification
- Multilingual supportHelp available every day
- Free demo accountUS$10,000 virtual to practice
Trading involves the risk of losing the capital invested.
