

 Português pt
 Español es
 العربية ar
 বাংলা bn
 Deutsch de
 Filipino fil
 Français fr
 हिन्दी hi
 Bahasa Indonesia id
 Italiano it
 Русский ru
 Svenska sv
 ไทย th
 Türkçe tr
 Tiếng Việt vi
 简体中文 zh
Updated:
StocksShort-Term Stock Trading: A 4-Step Guide
 Rafael AzevedoEditorial character · Markets Desk

Quick answer
To trade stocks short-term, follow four steps: choose liquid stocks, measure each one's volatility (for example, with the ATR), identify the hours with the most movement, and calculate the position size from the accepted risk and the stop distance. The risk of loss is immediate, which is why everything is defined before entering.
Trading stocks over short horizons, from a few minutes to a few days, calls for different criteria than those used by someone investing with years in mind. Liquidity, volatility, and proximity to events start to matter more than the company's long-term fundamentals.
This guide organizes the process into four steps and uses real daily quotes for Nvidia (NVDA) between April and October 2026 to show how to measure volatility and calculate the size of each position.
What short-term stock trading is
It means seeking the result of price moves that happen over hours or days, entering and exiting the position with rules defined beforehand. The difference from long-term investing isn't just the timeframe: the number of trades is higher, costs weigh more, and a single bad day can undo the result of several good trades.

The 4 steps for short-term trading
Step 1: choose liquid stocks
A thinly traded stock tends to have a wider spread, the gap between the bid and ask price, and that cost shows up before any move in your favor. Between April and October 2026, Nvidia traded an average of about 139.9 million shares a day, and Apple, about 49.3 million. Stocks with that kind of volume tend to have more predictable execution.
Step 2: measure the stock's volatility
Two large stocks can have very different volatility. Over the same period, Nvidia moved an average of 1.87% a day between closes; Apple, 1.25%. Nvidia's 14-day ATR on October 7, 2026, was $5.61, or 2.36% of the $237.47 price; Apple's was $6.58, or 1.95% of the $336.67 price. More volatility calls for a smaller position for the same dollar risk.
Step 3: map the hours with the most movement
On most exchanges, the open and the close concentrate the highest volume and the sharpest moves; the middle of the session tends to be calmer. Figure out which window your method works best in, and avoid trading during low-liquidity hours, when a larger order can move the price.
Step 4: define the entry and the size before anything else
Choose what triggers the entry (a level breakout, a reaction to an earnings report, a moving-average crossover) and calculate the size from the maximum accepted risk, not from how much seems reasonable to invest at that moment.
How to calculate position size with the ATR
A $5,000.00 account, 1% risk per trade ($50.00), and a stop at 1 ATR from the entry price. With Nvidia's numbers on October 7, 2026:
- Stop distance: 1 × 5.61 = $5.61
- Quantity: 50.00 ÷ 5.61 = 8.91 → 8 shares
- Position value: 8 × 237.47 = $1,899.76
With the ATR at the period's lowest level, $4.88 on April 22, the same calculation would give 10 shares; with the ATR at its highest level, $8.56 on June 9, only 5. The dollar risk doesn't change; the size tracks volatility.

Real example: Nvidia in 2026
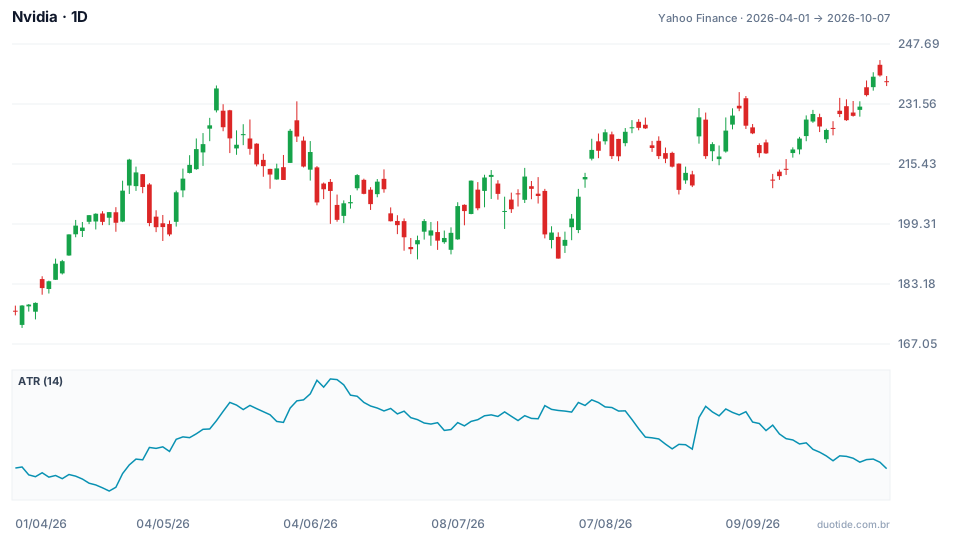
The chart shows Nvidia's daily price from April 1, 2026, to October 7, 2026, and, below, the 14-day ATR. The stock started the period at $175.75, had a low of $171.37 on April 2 and a high of $243.37 on October 6, and closed October 7 at $237.47, up 35.1%.
June: rising volatility
On June 5 the stock fell 6.2%, from $218.66 to $205.10. On June 9 it swung between $211.40 and $199.34 within the same day, and the ATR reached $8.56, the period's highest. Anyone who kept April's position size, when the ATR was near $5, ended up with about 70% more risk than planned.
August 27: the opening jump
The stock closed August 26 at $209.66, with the ATR at $6.26. The next day it opened at $222.86, 6.3% higher, and closed at $227.98, up 8.7%. Anyone short 7 shares with a stop at 1 ATR planned to lose 7 × 6.26 = $43.82; with the open $13.20 above the previous close, the loss would be about 7 × 13.20 = $92.40. On August 28 the stock gave back part of the jump and closed at $217.55, down 4.6%. The examples describe what happened, not what will happen.
How to use this process
Keep a short list
Instead of looking for opportunity in any stock, keep five to ten names with known liquidity and volatility and review the list periodically, because each stock's behavior changes over the months.
Count the costs
With more trades, fees and spread weigh proportionally more. Add those costs in when judging whether the strategy pays off compared with an approach that trades less.
Watch out for earnings and news
Earnings releases and after-hours news trigger jumps like August's. If you don't want that risk, cut the position or close it before the release.
Limitations
The ATR and the average move describe the recent past and change fast. The stop doesn't guarantee the exit price when there's an opening gap. No process eliminates the risk of loss.
Common mistakes in short-term stock trading
- Trading thinly traded stocks and paying a high spread on every entry and exit.
- Using the same number of shares on stocks with different volatility.
- Increasing the position because conviction feels strong.
- Holding a position through earnings without considering the possible jump.
- Ignoring the accumulated cost of many trades.
- Not logging trades and not knowing where the losses happen.
To practice, build a list of five stocks on a demo account, calculate the ATR and the size of each position before entering, and log the date, reason, time, size, and result. After a few weeks, the record shows whether the losses come from the stock picked, the time of day, or the execution.
Practice before you risk. Open your Duotide account and test your ideas on the demo account with US$10,000 in virtual funds.
Create free accountUpdated:
Editorial character of the Duotide newsroom. Articles are written by the team with the help of artificial intelligence; prices and charts come from real market data. Follows the news that moves prices — rates, stock markets, companies and commodities — explained without jargon.
Was this article helpful?
Be the first to rate it.
Comments
- No comments yet. Be the first to comment.
Ready to put it into practice?
Open your account and practice on the demo account with US$10,000 in virtual funds, without risking money.
- Secure platformProtected login and identity verification
- Multilingual supportHelp available every day
- Free demo accountUS$10,000 virtual to practice
Trading involves the risk of losing the capital invested.
