

 Português pt
 Español es
 العربية ar
 বাংলা bn
 Deutsch de
 Filipino fil
 Français fr
 हिन्दी hi
 Bahasa Indonesia id
 Italiano it
 Русский ru
 Svenska sv
 ไทย th
 Türkçe tr
 Tiếng Việt vi
 简体中文 zh
Updated:
Technical analysisChart Patterns: Which Ones Are Worth Following and How to Confirm Them
 Naomi TanakaEditorial character · Analysis Desk

Quick answer
The chart patterns most worth following are the simplest and most frequent ones: double top and bottom, head and shoulders, triangles, rectangles, and flags. They're easy to draw, have a clear confirmation rule, a line breakout with a close, and let you set a stop and target before entering. None of them work every time: a pattern's value is in organizing the trade's risk, not in predicting the price.
There are dozens of chart patterns with their own names, from flags to diamonds, from cup and handle to wedges. Trying to follow all of them usually backfires: anyone looking for too many shapes ends up seeing patterns in every chart. It makes more sense to master a few, the ones that show up often and have objective rules.
In this guide we show which patterns these are, how to confirm and measure each one, and, to move past theory, three cases read from real daily Ibovespa quotes (Yahoo Finance data) between April and October 2026, including a pattern that got confirmed and failed right after.
What Chart Patterns Are
They're shapes the price draws over and over, reflecting the struggle between buyers and sellers. They fall into two groups:
- Reversal patterns: show up at the end of a trend and suggest a change in direction. Examples: double top, double bottom, head and shoulders.
- Continuation patterns: are pauses in the middle of a trend, after which the price tends to keep going in the same direction. Examples: triangles, rectangles, flags, and pennants.

Which Chart Patterns Are Worth Following
Double Top and Double Bottom
Two peaks (or troughs) at similar levels, separated by a pullback. Confirmation comes with a close beyond the point between them, the neckline. It's the easiest pattern to draw and one of the most frequent.
Head and Shoulders
Three peaks, the middle one the tallest, confirmed by the breakout of the line connecting the troughs. Less frequent than the double top, but with well-known rules. The inverted version shows up at bottoms.
Triangles
Ranges that narrow, with converging lines. Ascending and descending ones have a bias; symmetrical ones depend on the side of the breakout.
Rectangles
Price stuck between horizontal support and resistance. They're objective: both lines are visible to anyone.
Flags and Pennants
Short consolidations after a very strong move. They show up a lot in stocks and cryptocurrencies after news.
Rare patterns, like the diamond, or highly subjective ones, like Elliott waves, can be studied, but they're hardly worth the effort for someone just starting out.
How to Calculate a Chart Pattern's Target
The technique common to almost all of them is the measured move: target = breakout point ± the pattern's height.
Example with the Ibovespa's Double Bottom
- First trough: close of 168,278 points on June 18, 2026
- Second trough: close of 166,335 points on August 18, 2026, 1.2% below the first
- Neckline: the highest close between the two, 178,000 points on August 3
- Height = 178,000 − 166,335 = 11,665 points
- Target = 178,000 + 11,665 = 189,665 points

Real Example: Three Patterns in the Ibovespa in 2026
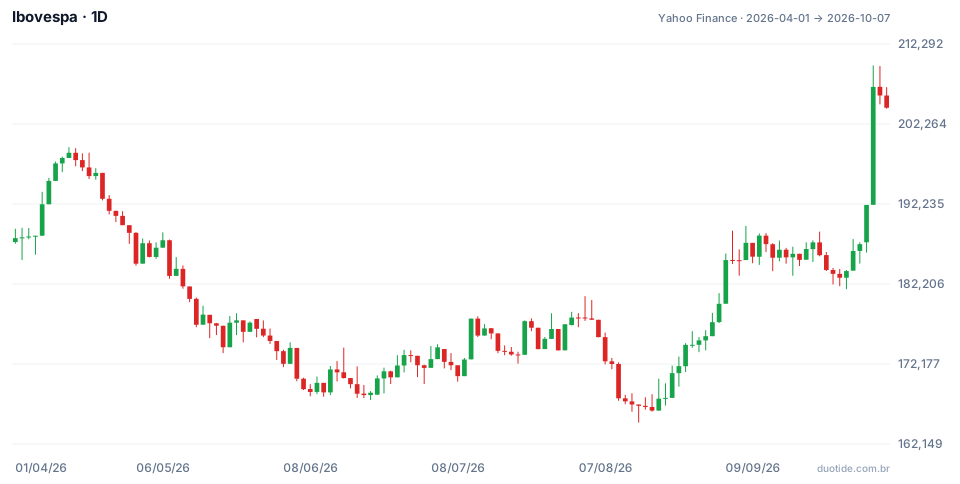
In the chart, the Ibovespa goes from 187,953 points on April 1, 2026 and closes on October 7, 2026 at 204,302, an 8.7% gain, with a low of 164,835 on August 14 and a high of 209,606 on October 5. Along the way, it drew three classic patterns.
Double Bottom Between June and August
The index had been declining: from the close of 198,657 on April 14 to 168,278 on June 18, a 15.3% pullback. After rising to 178,000 on August 3, it fell back to 166,335 on August 18, close to the first trough. The neckline breakout came on September 1, with a close of 179,723, and the next day the index jumped to 185,205 with volume above the previous days. The 189,665 target was only cleared on a close on October 2, a month later, at 192,115.
A Failed Double Top in September
On September 10 the index closed at 188,269 and, on September 22, at 187,423, two very close peaks. The lowest close between them was 185,229, on September 18. On September 24 the index closed at 183,966, below that point: by the rules, a confirmed double top, with a target at 188,269 − 3,040 = 182,189. The September 29 intraday low reached 181,562, but the lowest close was 182,991, on September 28. From there the index rose 11.6% through October 7. Anyone who sold the breakout without a stop took a big loss in just a few days.
Rectangle and October Breakout
Seen from a distance, the whole phase from September 2 to October 1 was a rectangle: closes between 182,991 and 188,269, a height of 5,278 points. The October 2 close, at 192,115, broke the ceiling, with a target of 193,547. On October 5 the index jumped 7.7% in a single trading day and closed at 206,912, far beyond the target. The same stretch of the chart held a bearish double top and a bullish rectangle; what decided it was which side it broke out on.
How to Use Chart Patterns
Wait for Confirmation
Until the close beyond the neckline or the edge of the consolidation, what exists is a possible shape. Entering before that is betting the pattern will complete.
Set the Stop Along with the Entry
On the September double top, a stop above the second peak (187,423) for a sale at 183,966 risked 3,457 points. It was hit on September 30, when the day's high reached 187,835. Without that stop, the loss would have kept growing in the following days.
Use the Right Timeframe
Patterns on the daily or weekly chart involve more participants and tend to be more reliable than those on minute charts, where they form and unravel all the time.
Look at Volume and Context
A breakout with higher volume, like the one on September 2, reinforces the read. On an index, interest rate news, politics, and foreign flows can override any shape.
Limitations
Patterns are subjective, the target measure is a convention, and the same region can hold opposite reads, as September showed. They don't predict the price; they help define where to enter, where you're wrong, and where to take profit.
Common Mistakes When Using Chart Patterns
- Trying to follow every pattern and seeing shapes in every chart.
- Entering before confirmation by the close.
- Trading without a stop because the pattern looked perfect, like September's double top.
- Treating the measured target as certain.
- Ignoring the bigger trend and the market's context.
- Forgetting that the examples above describe what happened, not what will happen.
To practice, pick two or three patterns from this list and look for them on the daily chart of assets you follow in your demo account. For each case, note the confirmation point, the stop, the target, and the result. After a few dozen entries you'll know which ones work in your market and which you can set aside.
Practice before you risk. Open your Duotide account and test your ideas on the demo account with US$10,000 in virtual funds.
Create free accountUpdated:
Editorial character of the Duotide newsroom. Articles are written by the team with the help of artificial intelligence; prices and charts come from real market data. Explains charts, indicators and trading strategies: how they work, where they fail and how to test them first.
Was this article helpful?
Be the first to rate it.
Comments
- No comments yet. Be the first to comment.
Ready to put it into practice?
Open your account and practice on the demo account with US$10,000 in virtual funds, without risking money.
- Secure platformProtected login and identity verification
- Multilingual supportHelp available every day
- Free demo accountUS$10,000 virtual to practice
Trading involves the risk of losing the capital invested.
