

 Português pt
 Español es
 العربية ar
 বাংলা bn
 Deutsch de
 Filipino fil
 Français fr
 हिन्दी hi
 Bahasa Indonesia id
 Italiano it
 Русский ru
 Svenska sv
 ไทย th
 Türkçe tr
 Tiếng Việt vi
 简体中文 zh
Updated:
Technical analysisChart Types for Technical Analysis
 Naomi TanakaEditorial character · Analysis Desk

Quick answer
The four most used chart types in technical analysis are line (close only, good for a general view), bar and candlestick (open, high, low, and close, good for entries and stops), and Heikin-Ashi (candles smoothed by an average, good for following a trend). The candlestick is the most used, but the best format depends on the question you want to answer.
Before learning any indicator, every trader has to decide something more basic: what format to look at the price in. The same asset, over the same period, looks quite different depending on the chart type, and that changes what's easy or hard to see.
There's no single right chart type for everyone. There's the one that fits the question you want to answer. To compare the formats with real numbers, we use the Ibovespa's real daily quotes between April and October 2026.
What each chart type is
Line chart
It connects only the closing prices of each period. It's the simplest to read and shows the overall direction without extra information. The limitation is exactly that: by using only the close, it hides what happened during the period. If the price rose a lot and gave it all back, the line won't show it.
Bar chart
Each bar shows four values: open, high, low, and close (the OHLC acronym). A tick to the left marks the open, one to the right marks the close, and the bar's height shows the distance between the high and the low. It carries the same information as a candlestick, in a visually more discreet way.
Candlestick
The candlestick, or Japanese candles, also shows the four prices, but with a colored body between the open and the close and shadows (the wicks) reaching the high and the low. A close above the open usually shows up green; below it, red. It's the most used format in trading, and patterns like engulfing, hammer, and shooting star only exist on it, because they depend on the shape of the body and the shadows.
Heikin-Ashi
Heikin-Ashi calculates each candle using averages that involve the previous candle. The chart gets smoother, and the trend becomes easier to see. In exchange, the candle doesn't show the real opening and closing price.

How to calculate the Heikin-Ashi candle
- Heikin-Ashi close = (open + high + low + close) ÷ 4, from the regular candle.
- Heikin-Ashi open = (previous Heikin-Ashi open + previous Heikin-Ashi close) ÷ 2.
- Heikin-Ashi high = the highest of the high, the Heikin-Ashi open, and the Heikin-Ashi close.
- Heikin-Ashi low = the lowest of the low, the Heikin-Ashi open, and the Heikin-Ashi close.
Example with the Ibovespa on October 5, 2026
That day's regular candle had an open of 192,138 points, a high of 209,606, a low of 192,138, and a close of 206,912. On October 2's Heikin-Ashi candle, the open was 185,459.4 and the close was 189,453.8.
- Heikin-Ashi close = (192,138 + 209,606 + 192,138 + 206,912) ÷ 4 = 200,198.5
- Heikin-Ashi open = (185,459.4 + 189,453.8) ÷ 2 = 187,456.6
- Heikin-Ashi high = 209,606 and Heikin-Ashi low = 187,456.6
The index closed the day at 206,912 points, but the Heikin-Ashi candle ends at 200,198.5. Anyone who reads Heikin-Ashi as if it were the real price ends up off by more than 6,000 points.
Real example: the Ibovespa in four formats
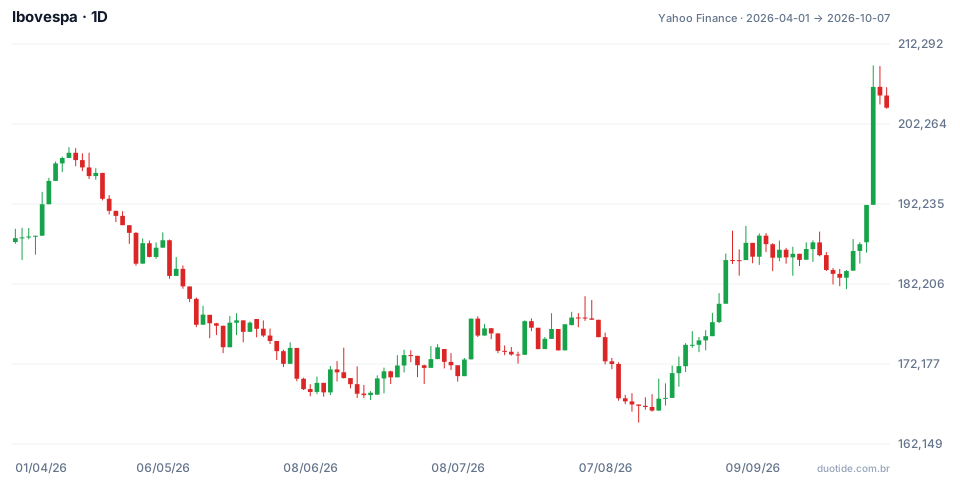
The chart above shows the Ibovespa's daily candles. Over the period, the index went from 187,953 points at the April 1 close to 204,302 on October 7, up 8.7%, with a low of 164,835 on August 14 and a high of 209,606 on October 5. Look at what each format would show in three moments:
October 5: what the line hides
On the line chart, October 5 shows up just as a jump from 192,115 (the October 2 close) to 206,912 points, up 7.7%. The candlestick shows more: the day's range was 17,468 points, the largest of the period, and the index closed 2,694 points below the high. Anyone deciding a stop and an entry needs that information; anyone who just wants the general direction doesn't.
August 19 to September 11: a cleaner trend on Heikin-Ashi
After August's low, Heikin-Ashi painted 17 green candles in a row, from August 19 to September 11. On the regular candlestick, four of those sessions were red (September 3, 4, 9, and 11). For anyone wanting to follow the trend without getting rattled by every pullback, Heikin-Ashi made the reading simpler. The index went from 166,335 points on August 18 to 187,207 on September 11.
October 6 and 7: Heikin-Ashi's lag
In the two days after the peak, the candlestick showed red candles and the index pulled back to 204,302 points. Heikin-Ashi stayed green on both days, because the average was still carrying the October 5 jump. The smoothing that helps you see the trend also delays the warning that it's losing steam.

How to use each chart type
General view: line
To know where an asset has gone over the past few months, or to compare two assets, the line chart is enough and avoids distraction.
Entry, stop, and patterns: candlestick or bars
To decide where to enter, where to place the stop, or to read reversal patterns, use the candlestick. The bar chart works for anyone who prefers the same data without the visual weight of the colors.
Following the trend: Heikin-Ashi
To hold a position in favor of the trend and filter out the noise, Heikin-Ashi helps. Many traders look at the context on Heikin-Ashi or the line chart and decide the entry on the candlestick.
Limitations
No format changes the underlying data: all of them are drawn from the same prices. Heikin-Ashi doesn't show the real price and lags at turning points; the line chart hides the range; the candlestick shows everything, but it also shows noise, which can lead to hasty decisions.
Common mistakes when choosing a chart type
- Using the Heikin-Ashi price to place orders or calculate results.
- Deciding a stop by looking only at the line chart, without seeing the highs and lows.
- Looking for candlestick patterns on a line chart or a Heikin-Ashi chart.
- Switching formats until you find one that confirms the opinion you already had.
- Forgetting that the examples above describe what happened, not what will happen.
To practice without risking money, open the same asset in a demo account in line, candlestick, and Heikin-Ashi format, side by side, and note over a few weeks which format showed each change in direction first. The record shows which reading works best for the way you trade.
Practice before you risk. Open your Duotide account and test your ideas on the demo account with US$10,000 in virtual funds.
Create free accountUpdated:
Editorial character of the Duotide newsroom. Articles are written by the team with the help of artificial intelligence; prices and charts come from real market data. Explains charts, indicators and trading strategies: how they work, where they fail and how to test them first.
Was this article helpful?
Be the first to rate it.
Comments
- No comments yet. Be the first to comment.
Ready to put it into practice?
Open your account and practice on the demo account with US$10,000 in virtual funds, without risking money.
- Secure platformProtected login and identity verification
- Multilingual supportHelp available every day
- Free demo accountUS$10,000 virtual to practice
Trading involves the risk of losing the capital invested.
