

 Português pt
 Español es
 العربية ar
 বাংলা bn
 Deutsch de
 Filipino fil
 Français fr
 हिन्दी hi
 Bahasa Indonesia id
 Italiano it
 Русский ru
 Svenska sv
 ไทย th
 Türkçe tr
 Tiếng Việt vi
 简体中文 zh
Updated:
Technical analysisElliott Wave Theory: What It Is and How to Apply It
 Naomi TanakaEditorial character · Analysis Desk

Quick answer
Elliott Wave Theory says the price advances in five waves in the direction of the trend (1 through 5) and corrects in three (A, B, and C). A count is only valid if wave 2 doesn't go past the start of wave 1, if wave 3 isn't the shortest, and if wave 4 doesn't enter wave 1's territory. Fibonacci helps estimate the size of the waves, but the count is subjective and only becomes clear after the move.
If you've ever heard someone mention wave 3 or wave C without understanding what it means, you've run into Elliott Wave Theory, one of the most traditional ways of interpreting price movement. Ralph Nelson Elliott developed it in the 1930s, from the observation that the market alternates between advancing and correcting phases in patterns that repeat, reflecting collective optimism and pessimism.
In this guide, instead of made-up numbers, we apply the theory to Ether's real daily quotes (ETH/USDT on Binance) between May and October 2026: a rally that, looking back, fits the five-wave structure well.
What Elliott Wave Theory is
Five impulse waves
In the direction of the trend, the price advances in five waves: three with the trend (1, 3, and 5) and two against it (2 and 4). Wave 3 is usually the longest and strongest, when the trend is already recognized by more participants. Waves 2 and 4 are pauses and profit-taking along the way.
Three correction waves
After the five waves, the market usually corrects in three waves, called A, B, and C. Wave A starts the correction, B is a partial recovery, and C completes the move, generally in the same direction as A. After C, a new cycle can begin.
The three counting rules
- Wave 2 never retraces past the start of wave 1.
- Wave 3 is never the shortest among waves 1, 3, and 5.
- Wave 4 doesn't enter wave 1's price territory (the rule with the most accepted exceptions, for example in diagonals).
If any rule is broken, the count is wrong and needs to be redone.

How to calculate targets with Fibonacci
Fibonacci ratios are used to estimate the likely size of each wave relative to the previous ones. The most commonly cited references:
- Wave 2: usually corrects between 38.2% and 61.8% of wave 1.
- Wave 3: usually measures about 1.618 times wave 1.
- Wave 4: usually corrects between 23.6% and 38.2% of wave 3.
- Wave 5: often ends up close to the size of wave 1.
The math is simple: wave size = end price − start price. Retracement = pullback ÷ previous wave's size. Projection = wave's start + reference size × ratio.
Real example: Ether's waves in 2026
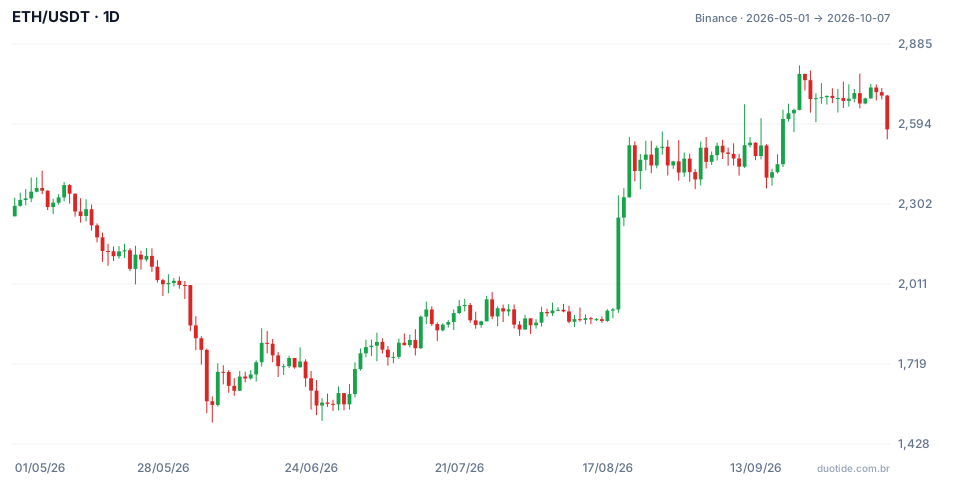
The chart shows ETH's daily candles. Using the daily highs and lows, one possible count for the rally between June and September is this:
- Start: a low of $1,505.68 on June 6.
- Wave 1: up to $1,981.24 on July 27, an advance of $475.56.
- Wave 2: a pullback to $1,822.06 on August 1.
- Wave 3: up to $2,566.53 on August 27, an advance of $744.47.
- Wave 4: a pullback to $2,356.41 on September 2.
- Wave 5: up to $2,807.34 on September 21, an advance of $450.93.
The rules held up
Wave 2 stopped at $1,822.06, well above the start at $1,505.68. Wave 3 ($744.47) was the longest of the three impulse waves. Wave 4's low ($2,356.41) stayed above wave 1's top ($1,981.24). The count is valid.
The Fibonacci ratios
Wave 2 pulled back $159.18, or 33.5% of wave 1 (159.18 ÷ 475.56), a bit less than the usual range. The 1.618 projection for wave 3 gave 1,822.06 + 1.618 × 475.56 = $2,591.52; the actual top came in at $2,566.53, about 1% below that. Wave 4 pulled back $210.12, or 28.2% of wave 3, inside the typical range. And wave 5 was 94.8% the size of wave 1.
After the September 21 top
If the count is right, a three-wave correction would follow wave 5. The entire rally measured $1,301.66 (from 1,505.68 to 2,807.34). The retracement levels sit at $2,310.11 (38.2%), $2,156.51 (50%), and $2,002.91 (61.8%). Through October 7, ETH closed at $2,574.14, with a low of $2,538.06 that day: at the low, the pullback was about 21% of the rally, still above the first level. There's no way to know, just from looking at the chart, whether the correction is over, whether it will reach one of these levels, or whether the count is wrong.

How to use Elliott Waves
The count as a hypothesis
Work with more than one count at a time. In the example above, another reading would start wave 1 at the June 26 low ($1,512.00), which would change the ratios. The count that becomes clear after the move was almost never the only one possible during it.
The rules as a stop
The rules say where the hypothesis dies. Anyone working with the idea that wave 2 ended on August 1 knew that if the price broke below $1,505.68, the count would be wrong. That point serves as an objective reference for the stop.
Combining with other indicators
Momentum indicators, like the RSI, help check the count: wave 3 usually comes with the strongest momentum, and wave 5 often shows up with a divergence, a higher price and a weaker indicator.
Limitations
The theory depends on interpretation: two analysts can count the same chart differently, especially in real time. Fibonacci ratios are references, not guaranteed targets: in the example, wave 2 fell outside the usual range. And a count that looks great in hindsight says nothing about the next move.
Common mistakes with Elliott Waves
- Forcing the count to confirm the opinion you already had.
- Ignoring the three rules and sticking with a count that's already been invalidated.
- Treating Fibonacci levels as exact reversal points.
- Counting waves on charts of just a few minutes, where noise creates waves everywhere.
- Trading without a stop because the count looks obvious.
- Forgetting that the examples above describe what happened, not what will happen.
To practice without risking money, open the daily chart of an asset in a demo account, mark highs and lows, work out two possible counts, and write down the point that would invalidate each one. Follow it for a few weeks and record which count the market confirmed. That exercise trains your eye better than any ready-made example.
Practice before you risk. Open your Duotide account and test your ideas on the demo account with US$10,000 in virtual funds.
Create free accountUpdated:
Editorial character of the Duotide newsroom. Articles are written by the team with the help of artificial intelligence; prices and charts come from real market data. Explains charts, indicators and trading strategies: how they work, where they fail and how to test them first.
Was this article helpful?
Be the first to rate it.
Comments
- No comments yet. Be the first to comment.
Ready to put it into practice?
Open your account and practice on the demo account with US$10,000 in virtual funds, without risking money.
- Secure platformProtected login and identity verification
- Multilingual supportHelp available every day
- Free demo accountUS$10,000 virtual to practice
Trading involves the risk of losing the capital invested.
