

 Português pt
 Español es
 العربية ar
 বাংলা bn
 Deutsch de
 Filipino fil
 Français fr
 हिन्दी hi
 Bahasa Indonesia id
 Italiano it
 Русский ru
 Svenska sv
 ไทย th
 Türkçe tr
 Tiếng Việt vi
 简体中文 zh
Updated:
MarketsHow Many Trading Days Are There in 2026 on US Markets and B3
 Rafael AzevedoEditorial character · Markets Desk

Quick answer
In 2026, US markets (NYSE and Nasdaq) have 251 trading days: that's 261 weekdays minus 10 holidays. February is the shortest month, with 19 sessions, and March, July, October, and December are the longest, with 22. On B3, the count by the holiday calendar comes to about 247 trading days.
Many traders set annual goals without ever counting how many real chances to trade exist in the year. The calendar isn't the same every month: holidays and weekends remove sessions unevenly, and one month can have three fewer trading days than another. For anyone splitting the year's goal into twelve equal parts, that difference turns into unnecessary pressure.
In this article we do the math for US markets and for B3 in 2026, checked against the sessions that actually happened through October 7, 2026 in the S&P 500 and Ibovespa data.
How to Calculate Trading Days
The math has two steps: count the year's weekdays and subtract the holidays when the market is closed.
- Weekdays: 2026 starts on a Thursday and isn't a leap year. That's 52 full weeks plus one day, which gives 52 × 5 + 1 = 261 Monday-to-Friday days.
- US market holidays that fall on a weekday: 10.
- Result: 261 − 10 = 251 trading days.
The 10 US Market Holidays in 2026
- January 1 (Thursday): New Year's Day.
- January 19 (Monday): Martin Luther King Jr. Day.
- February 16 (Monday): Presidents' Day.
- April 3 (Friday): Good Friday.
- May 25 (Monday): Memorial Day.
- June 19 (Friday): Juneteenth.
- July 3 (Friday): Independence Day, observed on Friday because the 4th falls on a Saturday.
- September 7 (Monday): Labor Day.
- November 26 (Thursday): Thanksgiving.
- December 25 (Friday): Christmas.
The first eight match the data: between January 1 and October 7, 2026, the only weekdays with no S&P 500 trading were exactly these. Besides the holidays, there are two shortened sessions, which close at 1 p.m. New York time: November 27, the day after Thanksgiving, and December 24, Christmas Eve. They usually have low volume.
Month by Month on US Markets
January 20, February 19, March 22, April 21, May 20, June 21, July 22, August 21, September 21, October 22, November 20, and December 22. February is the shortest; March, July, October, and December are the longest. Through October 7 there were 192 sessions, with 59 left in the year.

And on B3
The Brazilian calendar is different. In the Ibovespa data, 2026's trading days were: January 21, February 18 (Carnival closed February 16 and 17), March 22, April 20 (Good Friday and Tiradentes Day), May 20, June 21 (Corpus Christi), July 23, August 21, and September 21 (Independence Day). That's 187 sessions from January to September.
For the last quarter, the holiday calendar calls for closures on October 12, November 2, November 20, December 24, December 25, and December 31, which would give October 21, November 19, and December 20, and a total of 247 trading days for the year. Always check B3's official calendar, which can change. July, with 23, is the longest month in Brazil, and in Carnival's month Brazil has one fewer trading day than the United States.
Real Example: What 192 Sessions Did to the S&P 500
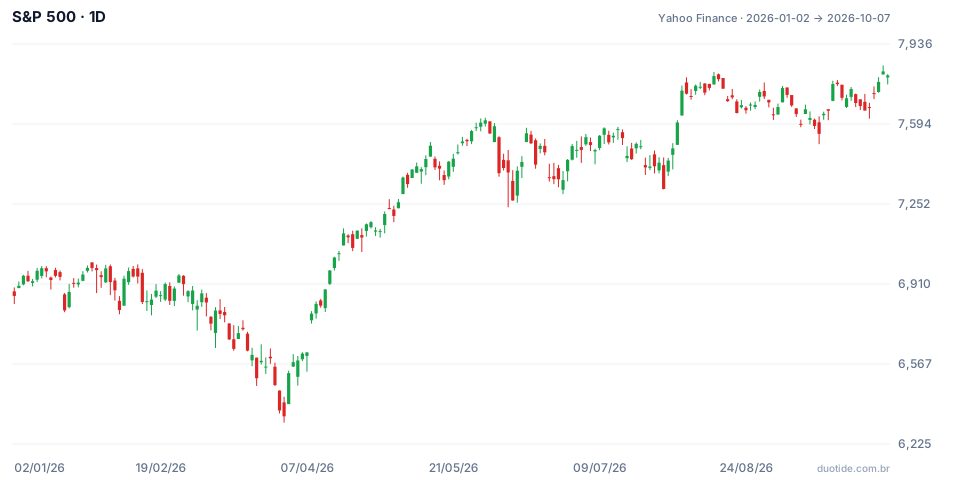
The chart shows the S&P 500's 192 sessions from January 2 to October 7, 2026. The index closed 2025 at 6,845.50 points and October 7, 2026 at 7,801.77, a 13.97% gain. The period's low was 6,316.91 points on March 30; the high, 7,844.52 points on October 6.
Few Days Make Up Most of the Result
Of the 192 sessions, 100 closed higher and 92 lower. The five best days, such as March 31 (+2.91%) and April 8 (+2.51%), accounted for almost the entire gain: without them, the cumulative rally would drop from 13.97% to 2.29%. On the Ibovespa, which rose 26.80% over the same period, from 161,125 to 204,302 points, the five best days mattered even more: without them, the rally would be 4.00%. On October 5 alone, the Brazilian index rose 7.70%.
This shows that the number of trading days doesn't translate into results in a linear way. Some days weigh far more than others, and they don't give advance warning. These numbers describe what happened in 2026; they don't indicate which the next strong days will be.

How to Use the Calendar in Your Planning
Spread the Goal by Session, Not by Month
Suppose an annual goal of R$ 1,200.00 trading US markets. Dividing by 251 trading days, that's about R$ 4.78 per session. February, with 19, works out to R$ 90.84; March, with 22, to R$ 105.18. With equal R$ 100.00-a-month goals, February would require more per session than March, and that's where the urge to force trades is born.
Mark the Atypical Days
Shortened sessions, days before a holiday, and the day after a long holiday usually behave differently: low volume beforehand, reaction to pent-up news afterward. Many traders reduce their position or don't trade on those days.
Cross the Calendars If You Trade More Than One Market
On February 16 and 17, B3 was closed and US markets opened on the 17th. On June 19 it was the other way around. Anyone trading assets from both countries needs both calendars. Forex keeps going almost without stopping, but with less liquidity on the major centers' holidays.
Limitations
The number of trading days is a planning reference, not an activity target. Trading every available day isn't mandatory, and many of a month's best decisions are the trades you didn't make.
Common Mistakes When Using the Calendar
- Dividing the annual goal into twelve equal parts, ignoring that February has up to three fewer trading days than other months.
- Forgetting American holidays like Juneteenth and the observed July 3rd.
- Using the US calendar for B3 assets, or the other way around.
- Trading shortened sessions with the same position size as a normal day.
- Forcing trades at the end of a short month to hit an arbitrary goal.
Before setting your goals, mark the holidays and shortened sessions of the markets you trade on the calendar and calculate the goal per session. Then test that plan in a demo account for a month and log how many trading days you actually traded and with what result: the record shows whether the goal is realistic.
Practice before you risk. Open your Duotide account and test your ideas on the demo account with US$10,000 in virtual funds.
Create free accountUpdated:
Editorial character of the Duotide newsroom. Articles are written by the team with the help of artificial intelligence; prices and charts come from real market data. Follows the news that moves prices — rates, stock markets, companies and commodities — explained without jargon.
Was this article helpful?
Be the first to rate it.
Comments
- No comments yet. Be the first to comment.
Ready to put it into practice?
Open your account and practice on the demo account with US$10,000 in virtual funds, without risking money.
- Secure platformProtected login and identity verification
- Multilingual supportHelp available every day
- Free demo accountUS$10,000 virtual to practice
Trading involves the risk of losing the capital invested.
