

 Português pt
 Español es
 العربية ar
 বাংলা bn
 Deutsch de
 Filipino fil
 Français fr
 हिन्दी hi
 Bahasa Indonesia id
 Italiano it
 Русский ru
 Svenska sv
 ไทย th
 Türkçe tr
 Tiếng Việt vi
 简体中文 zh
Updated:
Technical analysisHow to Build an Entry Plan With Candlesticks, Step by Step
 Naomi TanakaEditorial character · Analysis Desk

Quick answer
A candlestick entry plan goes beyond recognizing the pattern: it requires context (support, resistance, or trend), a confirmation trigger (a break above or below the candle's high or low), a stop on the other side of the pattern, a target, and a position size calculated from the maximum accepted loss. Without these rules, the candle is just an observation, not a trade.
A lot of people start by memorizing a list of candlestick patterns, like the hammer, the engulfing, and the shooting star, and then treat them as automatic buy or sell signals. The problem is that the same candle means different things depending on where it shows up, and a pattern alone doesn't say where to enter, where to exit, or how much to risk.
This guide doesn't repeat the list of patterns. It shows how to turn a candle into a full plan and applies that plan to three real situations on Nvidia's daily chart (NVDA, Yahoo Finance) between April and October 2026: one that worked out, one that never even got executed, and one that lost.
What a candlestick entry plan is
An entry plan is a set of rules decided before the trade. With candles, it has five parts:
- Context: did the pattern show up in a relevant spot, like a support, a resistance, or the end of a string of declines or rallies?
- Pattern: does the candle have the proportions that define it? In a hammer, for example, the lower wick is at least twice the size of the body and there's almost no upper wick.
- Trigger: the entry only happens if the price confirms it, usually by breaking above the candle's high (for a buy) or below its low (for a sell).
- Stop: the point where the pattern stops being valid, usually on the other side of the candle.
- Target and size: where to take profit and how many shares to buy so the loss at the stop is acceptable.

How to calculate the stop, target, and position size
With the entry and stop defined, the risk per share is the distance between them. The target can be a multiple of that risk, such as 2 times. Position size comes from the maximum loss you accept per trade:
- Risk per share = entry − stop (on a buy).
- Target = entry + 2 × risk per share.
- Quantity = maximum accepted loss ÷ risk per share.
With a US$10,000 account and a maximum loss of 1% (US$100), a risk of US$5.37 per share allows you to buy 100 ÷ 5.37 = 18 shares, rounding down.
Real example: three Nvidia candles in 2026
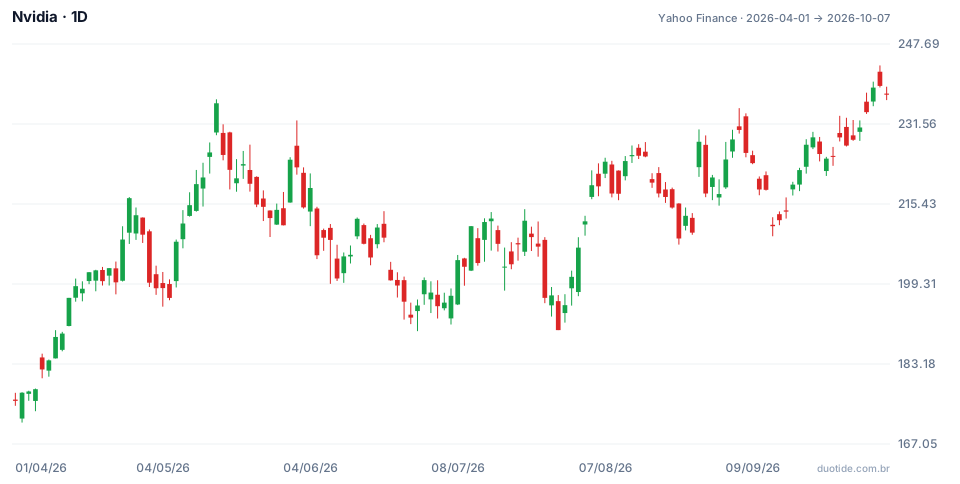
Nvidia started the period at US$175.75 on April 1, 2026, and ended at US$237.47 on October 7, 2026, up 35.12%. Average volume was 139.9 million shares per day. We applied the same plan to three candles:
May 27: a confirmed hammer that hit its target
After pulling back from US$218.18 to a low of US$208.78, the stock formed a hammer: it opened at US$214.12, closed at US$212.60, and had a high of US$214.15. The lower wick (US$3.82) was more than double the body (US$1.52), with volume of 167.6 million, above average.
- Trigger: buy above US$214.15. On May 28 the high was US$215.52: entry executed.
- Stop: below the hammer's low, US$208.78. Risk: 214.15 − 208.78 = US$5.37 (2.5%).
- Target of 2 times the risk: 214.15 + 10.74 = US$224.89.
The following lows stayed above the stop. On June 1 the high reached US$224.87, two cents short of the target, and on June 2 the price went to US$232.28: target hit, a gain of US$10.74 per share.
June 9: an unconfirmed hammer, a trade that never happened
On June 9 another hammer appeared: it opened at US$210.62, had a low of US$199.34, closed at US$208.19, and had volume of 181 million. The trigger was breaking above US$211.40, the candle's high. Over the next three sessions the highs were US$207.22, US$205.66, and US$207.07: the trigger was never hit. Ten sessions later, the stock was at US$199.00, and the low in that stretch was US$196.58. The confirmation requirement kept the trade from happening.
August 17: a shooting star that fell, but the trade lost
On August 17, near the highs of that stretch, the stock formed a shooting star: it opened at US$225.98, rose to US$227.92, and closed at US$225.01. The sell plan had a trigger below the low, US$224.86, and a stop above the high, US$227.92. The next day the stock gapped down, opening at US$220.45: the order was filled there, below the trigger, which changes the risk to 227.92 − 220.45 = US$7.47 and the target to 220.45 − 14.94 = US$205.51.
The price fell to US$207.25 on August 24, but never reached the target. On August 27 the stock rallied hard, up to US$230.47, and triggered the stop: a loss of US$7.47 per share. The pattern got the direction right for a few days, and the trade still lost. That's why the plan matters more than the candle's name.

How to use candlesticks with a method
Context before the pattern
A hammer after a string of declines, near a support, carries different weight than a hammer in the middle of a rally. Mark supports and resistances before looking for patterns.
Confirmation as a filter
Waiting for a break above or below the candle's high or low makes you miss part of the move, but it filters out patterns that fail quickly, like the one on June 9.
Opening gaps change the risk
When the price opens past the trigger, as on August 18, the entry fills at a different price. Recalculate risk and target, or decide in the plan not to enter if the gap is too large.
Limitations
Three cases don't make a statistic: they're meant to show the process, not the effectiveness of the patterns. The definition of each pattern varies between authors and platforms, and past results don't guarantee future ones.
Common mistakes when trading candlesticks
- Entering at the candle's close, without waiting for confirmation.
- Ignoring context and trading the pattern anywhere on the chart.
- Not defining a stop before the entry.
- Sizing the position by the money available, instead of by the maximum accepted loss.
- Forgetting that opening gaps change the entry price and the risk.
- Judging the method by one trade: the August 17 one lost even with the price falling after the pattern.
To practice, pick one or two patterns, write out the full plan with context, trigger, stop, target, and size, and apply it on a demo account for a few weeks. Also log the patterns that never triggered: they teach as much as the trades you actually made.
Practice before you risk. Open your Duotide account and test your ideas on the demo account with US$10,000 in virtual funds.
Create free accountUpdated:
Editorial character of the Duotide newsroom. Articles are written by the team with the help of artificial intelligence; prices and charts come from real market data. Explains charts, indicators and trading strategies: how they work, where they fail and how to test them first.
Was this article helpful?
Be the first to rate it.
Comments
- No comments yet. Be the first to comment.
Ready to put it into practice?
Open your account and practice on the demo account with US$10,000 in virtual funds, without risking money.
- Secure platformProtected login and identity verification
- Multilingual supportHelp available every day
- Free demo accountUS$10,000 virtual to practice
Trading involves the risk of losing the capital invested.
