

 Português pt
 Español es
 العربية ar
 বাংলা bn
 Deutsch de
 Filipino fil
 Français fr
 हिन्दी hi
 Bahasa Indonesia id
 Italiano it
 Русский ru
 Svenska sv
 ไทย th
 Türkçe tr
 Tiếng Việt vi
 简体中文 zh
Updated:
Technical analysisHow to Choose the Best Timeframe for Your Profile
 Naomi TanakaEditorial character · Analysis Desk
Quick answer
The best timeframe is the one that fits the time you have to follow the market and the risk you accept per trade. Anyone who only checks the chart once a day tends to do better on the daily; anyone glued to the screen during trading hours can use minute charts. Using a larger timeframe for direction and a smaller one for the entry reduces false signals.
The same asset, on the same day, can look like it's rising on the 15-minute chart, falling on the daily, and moving sideways on the weekly. None of them is wrong: each timeframe shows a different slice of the same move. The problem starts when someone picks the timeframe at random, or switches from one to another mid-trade to justify the decision they already wanted to make.
In this guide, we use bitcoin's real quotes (BTC/USDT on Binance) between April and October 2026 to compare what the daily and weekly charts showed over the same period, and how that translates into choosing a timeframe.
What the timeframe is
It's the period each candle represents. On the 5-minute chart, each candle sums up 5 minutes of trading; on the daily, a whole day; on the weekly, a week. The shorter the timeframe, the more candles, more signals, and more noise; the longer, fewer signals, longer moves, and wider stops.
- 1 to 15 minutes: trades within the day. Requires watching the screen during trading hours.
- 1 to 4 hours: trades lasting one to a few days. Requires checking the chart a few times a day.
- Daily: trades lasting days to weeks (swing trading). One check a day is enough.
- Weekly: trades lasting weeks to months. One check a week is enough.

How to choose the timeframe
By available time
Choose a timeframe where you can see the close of every relevant candle. Someone who works all day and only opens the platform at night can't follow 15-minute candles, but can follow the daily one without trouble.
By risk tolerance
Larger timeframes call for wider stops in money terms, because the price swings more within each candle. On October 7, 2026, bitcoin's 14-day ATR stood at US$ 2,187.23. A 1 ATR stop on the daily chart, then, sat more than US$ 2,000 from the entry. To keep the same money risk, the position needs to be smaller.
Combining two timeframes
A common practice is to use a larger timeframe for direction and a smaller one for the entry, at a ratio of four to six times: weekly with daily, daily with 4 hours, 1 hour with 15 minutes. You only trade in the direction the larger timeframe points to.
Real example: bitcoin on the daily and weekly charts in 2026
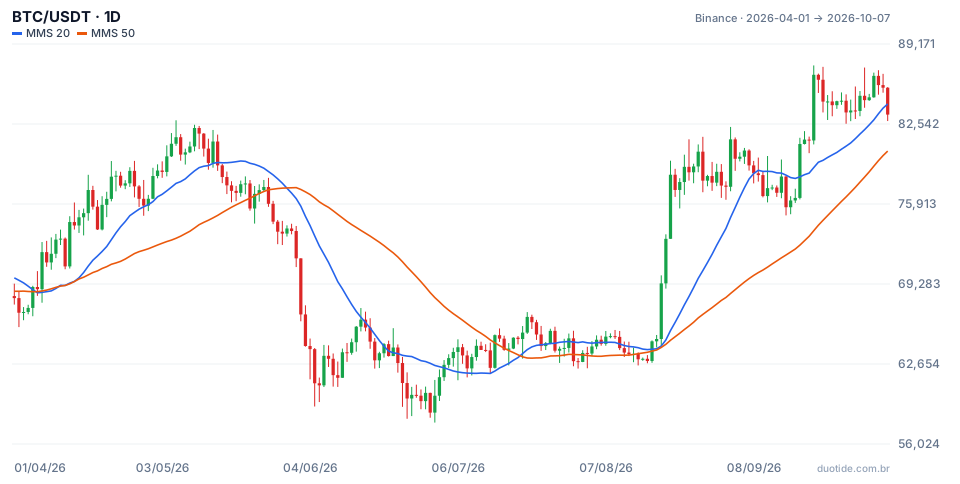
The daily chart shows BTC with the 20-day (blue) and 50-day (orange) simple moving averages. Between April 1 and October 7, 2026, the price went from US$ 68,113.92 to US$ 83,321.81, up 22.33%, with a low of US$ 57,800.19 on July 1 and a high of US$ 87,395.67 on September 21.
The daily chart's noise
Of the period's 190 daily candles, 97 closed up and 93 closed down, practically a coin flip. The price crossed the 20-day average 20 times. And the two averages gave opposite signals five days apart: the 20 crossed below the 50 on April 6 (price of US$ 68,853.66) and crossed back above on April 11 (US$ 73,043.16). Anyone trading every crossover on the daily chart would have entered and exited within days.
The same story seen on the weekly chart
Grouping the same data into 27 weeks, Monday through Sunday, between March 30 and October 4, the picture gets cleaner: 16 up weeks and 11 down weeks. Of the six weeks starting between March 30 and May 4, five closed up. Between June 29 and August 16, seven straight weeks closed between US$ 62,900 and US$ 65,400, a clearly sideways market, something hard to spot in the daily back-and-forth.
Daily candles against the week
In the week of June 1, BTC fell 14.04%, from US$ 73,674.39 to US$ 63,332.01. Even so, Sunday, June 7, rose 4.02%. In the week of August 17, the price rose 23.58%, from US$ 62,900 to US$ 77,734, and yet August 22 closed down 1.61%. Anyone looking only at the daily chart might read these days as a change in direction; on the weekly, they're pauses within bigger moves. These examples describe what happened, not what will happen.

How to use the timeframe in practice
Pick a main one and stick with it
Set your strategy's timeframe and always use the same one for the entry, stop, and exit. Switching charts mid-trade is a common way to delay a stop.
Use the larger one as a filter
Before trading on the daily chart, check the weekly. If the weekly is clearly falling, buys on the daily are fighting the tide.
Adjust the position size
Moving up a timeframe, the stop grows in money terms. Recalculate the position size so the maximum loss still fits within what you accept.
Limitations
Larger timeframes give fewer, slower signals: the weekly signal usually arrives after part of the move has already happened. Smaller timeframes have more noise and more costs, because they generate more trades. There's no flawless timeframe, only the one that best fits your routine.
Common mistakes when choosing the timeframe
- Choosing a short timeframe without having time to follow every candle.
- Analyzing on the daily chart and exiting on the 5-minute chart, or the reverse.
- Reading a single daily candle as a reversal, without checking the weekly.
- Using the same money stop when switching timeframes.
- Switching timeframes after a loss, instead of judging the strategy over a large enough sample.
To practice without risking money, pick a main timeframe and a larger one as a filter on a demo account, trade only in the direction of the larger one for a few weeks, and log every trade with the timeframe used for the entry and the exit. The record quickly shows whether the chosen timeframe fits your routine.
Practice before you risk. Open your Duotide account and test your ideas on the demo account with US$10,000 in virtual funds.
Create free accountUpdated:
Editorial character of the Duotide newsroom. Articles are written by the team with the help of artificial intelligence; prices and charts come from real market data. Explains charts, indicators and trading strategies: how they work, where they fail and how to test them first.
Was this article helpful?
Be the first to rate it.
Comments
- No comments yet. Be the first to comment.
Ready to put it into practice?
Open your account and practice on the demo account with US$10,000 in virtual funds, without risking money.
- Secure platformProtected login and identity verification
- Multilingual supportHelp available every day
- Free demo accountUS$10,000 virtual to practice
Trading involves the risk of losing the capital invested.
