

 Português pt
 Español es
 العربية ar
 বাংলা bn
 Deutsch de
 Filipino fil
 Français fr
 हिन्दी hi
 Bahasa Indonesia id
 Italiano it
 Русский ru
 Svenska sv
 ไทย th
 Türkçe tr
 Tiếng Việt vi
 简体中文 zh
Updated:
BeginnersHow to Start Trading: A Step-by-Step Plan for This Year
 Marina CostaEditorial character · Beginner's Guide

Quick answer
To start trading with a method, set the plan before the strategy: choose a market, spend a period in a demo account, fix how much you'll risk per trade (1% to 2% of capital is a common starting point), calculate the position size from the asset's volatility, and set dates to review the plan. Market predictions help little if this structure doesn't exist.
At the start of every year, lists of assets to watch and market predictions start showing up. They have their value, but they solve little for anyone who hasn't organized the basics yet: how they'll study, how much they'll risk, and what they'll consider success.
This guide covers that planning. Instead of made-up examples, the risk calculation uses Apple's real stock volatility between April and October 2026, to show how the numbers change the size of each trade.
Step 1: Choose a Market Before Choosing an Asset
Stocks, forex, cryptocurrencies, and commodities have different hours, volatility, and price drivers. Following all four at once, right at the start, spreads your attention thin and makes it harder to build a repertoire. Choosing one main market for the first few months yields more understanding than scratching the surface of several.

Step 2: Set Aside a Study Phase in a Demo Account
A demo account lets you test a method without the emotional weight of risking money. The goal isn't to win in the demo, but to measure how often the read made before the trade gets confirmed afterward, and adjust the method from that. A period of two to three months, with the trades logged, already generates a useful sample.
Step 3: Set Your Risk Rules Before the Strategy
The order matters. First decide how much capital you'll set aside for trading. Then, the maximum fraction risked per trade: 1% to 2% of the balance is a conservative starting point. Only then choose the entry strategy. Doing it the other way around, picking the strategy and thinking about risk afterward, is one of the most common mistakes beginners make.
Step 4: Calculate Position Size from Volatility
Knowing how much to risk isn't enough: you need to translate that amount into a quantity. For that, the stop needs to respect how much the asset usually swings. A practical measure is the ATR (average true range), the average daily range over the last 14 trading days.
The Math, with Real Numbers
Suppose a capital of $5,000 and a maximum risk of 1% per trade, or $50. On October 7, 2026, Apple's stock closed at $336.67, with an ATR of $6.58.
- Stop at 2 times the ATR: 2 × 6.58 = $13.16 below the entry.
- Quantity: 50 ÷ 13.16 = 3.8, rounded down: 3 shares.
- Position value: 3 × 336.67 = $1,010.01, about 20% of the capital.
- Loss if the stop is hit: 3 × 13.16 = $39.48, within the $50 limit.
Real Example: How Apple's Volatility Changed the Plan
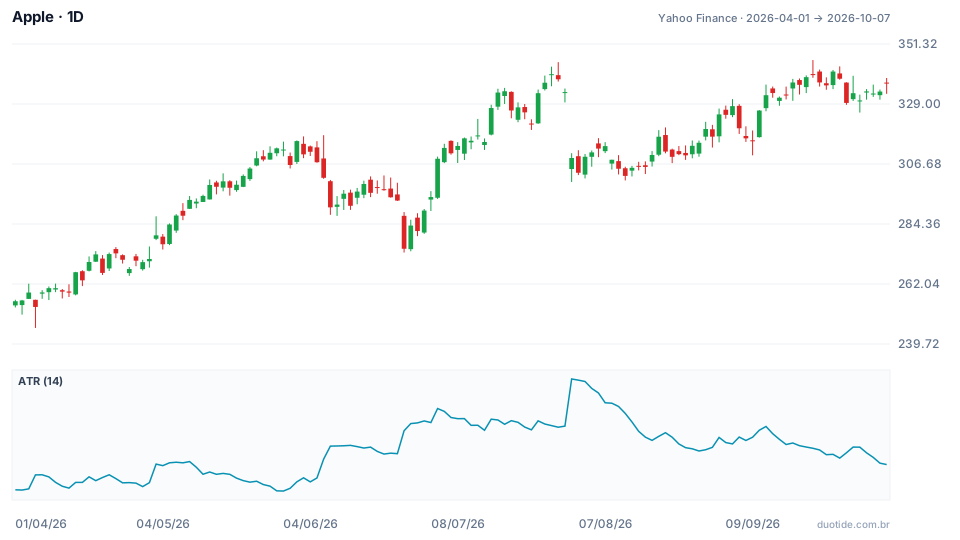
The chart shows Apple's price and the 14-day ATR between April 1 and October 7, 2026. The stock went from $255.63 to $336.67 over the period, a 31.7% gain, but the size of the daily swings varied a lot along the way:
May: The Calmest Phase
On May 29 the ATR marked the period's lowest value, $5.57, with the stock at $312.06. With the same 2 ATR stop ($11.14), the $50 risk allowed for 4 shares (50 ÷ 11.14 = 4.5).
July: The Most Agitated Phase
On July 31 the ATR reached $9.87, the window's highest, with the stock at $308.91. The 2 ATR stop became $19.74, and the same $50 risk allowed for only 2 shares (50 ÷ 19.74 = 2.5). Anyone keeping 4 shares with that stop would be risking 4 × 19.74 = $78.96, almost 60% above the plan's limit.
October: Back to the Middle Ground
With the ATR at $6.58 on October 7, the math went back to 3 shares. The risk rule never changed; what changed was the market, and the quantity followed. These numbers describe what happened in the period and don't indicate the stock's future behavior.
Step 5: Know the Worst-Case Scenario Before Starting
With a $50 risk per trade, ten losses in a row add up to at most $500, or 10% of the starting capital. Streaks like that happen even with methods that work. If losing 10% over a few weeks would make it impossible to stick with the plan, the risk per trade is too high for you, and it's better to find that out beforehand.
Step 6: Build a Simple, Sustainable Routine
You don't need to spend the whole day in front of charts. A realistic routine can be 20 to 30 minutes a day reviewing the chosen market and a fixed weekly slot to review closed trades, comparing the plan with what actually happened. A simple log, with date, asset, reason for entry, stop, size, and result, turns into a personal database in a few months about what works.
Step 7: Review the Plan at Set Milestones
Switching strategies after two or three bad trades gets in the way of learning, because no method wins every time. Set review milestones, such as the end of every month or every 50 trades, to evaluate the method with a larger sample before adjusting or abandoning it.
Limitations of the Plan
The ATR measures past swings; an unexpected event can generate a jump bigger than the stop, and the actual loss can exceed the planned amount. That's why the risk limit per trade should be conservative, and the capital set aside for trading should be an amount whose loss doesn't jeopardize your personal finances.
Common Mistakes of Beginner Traders
- Choosing the strategy before deciding how much they can lose.
- Always using the same number of shares or lots, ignoring that volatility changes.
- Skipping the demo account phase or treating it like a game, without logging the trades.
- Following too many markets at once in the first few months.
- Switching methods after every bad streak, without enough of a sample to evaluate.
- Ignoring the worst-case scenario and discovering their own tolerance for losses with real money.
To put the plan into practice, open a demo account, choose an asset, calculate the ATR and the position size before each trade, and log everything. After a few weeks, your record will show whether the plan is sustainable, which is worth more than any list of predictions for the year.
Practice before you risk. Open your Duotide account and test your ideas on the demo account with US$10,000 in virtual funds.
Create free accountUpdated:
Editorial character of the Duotide newsroom. Articles are written by the team with the help of artificial intelligence; prices and charts come from real market data. Answers the first questions of those just starting out: account, platform, basic concepts and common mistakes.
Was this article helpful?
Be the first to rate it.
Comments
- No comments yet. Be the first to comment.
Ready to put it into practice?
Open your account and practice on the demo account with US$10,000 in virtual funds, without risking money.
- Secure platformProtected login and identity verification
- Multilingual supportHelp available every day
- Free demo accountUS$10,000 virtual to practice
Trading involves the risk of losing the capital invested.
