

 Português pt
 Español es
 العربية ar
 বাংলা bn
 Deutsch de
 Filipino fil
 Français fr
 हिन्दी hi
 Bahasa Indonesia id
 Italiano it
 Русский ru
 Svenska sv
 ไทย th
 Türkçe tr
 Tiếng Việt vi
 简体中文 zh
Updated:
Technical analysisHow to Read a Price Chart: A Beginner's Guide
 Naomi TanakaEditorial character · Analysis Desk

Quick answer
To read a price chart, start with the timeframe (how much time each candle represents), then identify the trend from the sequence of highs and lows, mark the support and resistance zones where price stopped before, and use volume to gauge the strength of the moves. These four pieces are enough to start, with no indicator at all.
For anyone who has never traded, a price chart looks like a jumble of colored bars. Behind each bar, though, there's a simple story: buyers and sellers fighting over a price during a period. Learning to read that story doesn't require any formula at the start.
In this guide we explain the four basic pieces, candles, trend, support and resistance, and volume, and apply each one to the real daily chart of Apple stock (AAPL, Yahoo Finance data) between April and October 2026.
What a price chart shows
The horizontal axis is time and the vertical axis is price. The most common way to draw each period is the candle, or candlestick. Each candle summarizes four prices:
- Open: the first price of the period.
- Close: the last price of the period.
- High and low: the extremes, shown by the wicks (the thin lines above and below the body).
- Color: green when it closed above the open, red when it closed below.
The timeframe defines how much time each candle represents: one minute, one hour, one day, one week. The same asset can be rising on the daily chart and falling on the 5-minute chart. That's why the first question when opening any chart is: what period does each candle show?

How to read trend, support, resistance, and volume
Trend
An uptrend is a sequence of increasingly higher highs and higher lows. A downtrend is the opposite: increasingly lower highs and lower lows. When the highs and lows stay roughly at the same level, the market is sideways.
Support and resistance
Support is a price region where declines have stopped more than once: buyers showed up there. Resistance is the opposite, a region where rallies have stopped. These are zones, not exact lines, and round numbers often work as a reference for a lot of people at the same time.
Volume
Volume is the quantity traded during the period. It shows the conviction behind the move: a sharp decline with volume well above average has more participants than the same decline on a quiet day.
Real example: the Apple chart in 2026
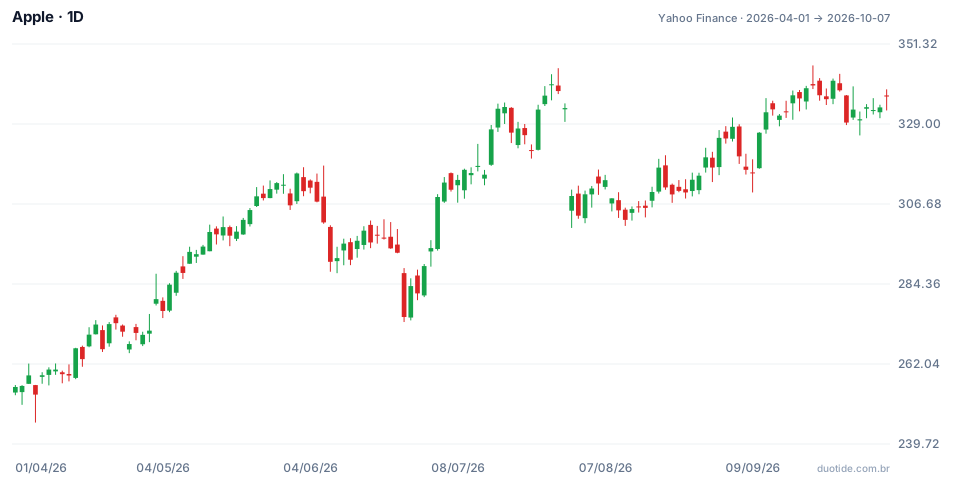
Each candle on the chart is one trading day. The stock started the period at US$255.63 on April 1, 2026, and ended at US$336.67 on October 7, 2026, up 31.7%. The low was US$245.70 on April 7, and the high was US$345.34 on September 22. Over the period, the average was 49.3 million shares traded per day.
April to July: higher highs and higher lows
After the April 7 low, the stock kept making higher highs: it passed US$300 in May and reached US$344.57 on July 29. The sharpest decline in the stretch came on June 25: the stock opened at US$287.40, below the previous close of US$293.08, and closed at US$275.15, down 6.1%, with 107 million shares traded, more than double the average. Even so, that day's low, US$273.75, stayed well above the April bottom. By June 30 the stock was already at US$289.36 and, in July, it went on to set new highs. It was a higher low: the uptrend was still intact.
August: US$300 becomes support
On July 31 the stock opened at US$304.81, well below the previous day's close of US$333.43, touched exactly US$300.00 at the low, and closed at US$308.91, with 132.5 million shares traded. Over the following weeks, the price came back near that level twice: a low of US$301.32 on August 4 and US$300.57 on August 12. All three times, buyers showed up above US$300. That's the typical shape of support. On August 19 the stock rose to US$316.83 and left the region.
September: resistance near US$345
On September 22 the stock hit the period's high, US$345.34, but closed at US$339.75. On September 28 it tried again, reached US$342.99, and the next day pulled back to US$329.40. Two attempts that stopped in the same zone form a resistance. As of October 7, the price hadn't broken through it.

How to use chart reading
Start with the bigger timeframe
Look at the daily or weekly chart first to know the main direction, and only then move down to smaller timeframes. A decline on the 15-minute chart can just be a pullback within a bigger rally.
Mark the zones, not the cents
Support and resistance are zones. In the example, support ranged from US$300.00 to US$301.32, not an exact price. Treating the level as a precise line leads to stops placed in the wrong spot.
Use volume as confirmation
Moves with volume well above average, like those on June 25 and July 31, call attention to changes in behavior. Low volume on a rally or decline suggests weak participation. Days with exceptional volume can also have technical causes, such as index rebalancing, so it's worth checking the context.
Limitations
The chart shows only what has already happened. Supports get broken, resistances get overcome, and trends end without warning. News, earnings, and interest rate decisions move the price in ways the pattern doesn't anticipate. The examples above describe what happened, not what will happen.
Common mistakes when reading charts
- Not checking the timeframe and comparing candles from different periods.
- Calling two or three days in the same direction a trend.
- Drawing support and resistance everywhere, until the chart turns into a grid of lines.
- Ignoring volume and treating every move as equally important.
- Loading the chart with indicators before learning to read price and volume.
- Believing a support will hold forever just because it held before.
To practice, open the daily chart of an asset you follow on a demo account, mark by hand the highs, lows, supports, and resistances of the last six months, and note what the price did in the following weeks. After a few charts, the reading becomes natural.
Practice before you risk. Open your Duotide account and test your ideas on the demo account with US$10,000 in virtual funds.
Create free accountUpdated:
Editorial character of the Duotide newsroom. Articles are written by the team with the help of artificial intelligence; prices and charts come from real market data. Explains charts, indicators and trading strategies: how they work, where they fail and how to test them first.
Was this article helpful?
Be the first to rate it.
Comments
- No comments yet. Be the first to comment.
Ready to put it into practice?
Open your account and practice on the demo account with US$10,000 in virtual funds, without risking money.
- Secure platformProtected login and identity verification
- Multilingual supportHelp available every day
- Free demo accountUS$10,000 virtual to practice
Trading involves the risk of losing the capital invested.
