

 Português pt
 Español es
 العربية ar
 বাংলা bn
 Deutsch de
 Filipino fil
 Français fr
 हिन्दी hi
 Bahasa Indonesia id
 Italiano it
 Русский ru
 Svenska sv
 ไทย th
 Türkçe tr
 Tiếng Việt vi
 简体中文 zh
Updated:
Technical analysisFibonacci in Trading: How to Draw and Use Retracements
 Naomi TanakaEditorial character · Analysis Desk

Quick answer
Fibonacci lines mark retracement levels (23.6%, 38.2%, 50%, 61.8%, and 78.6%) of a prior move, used as possible support or resistance zones during a pullback. To draw them, connect the low to the high of a clear leg: each level is the high minus a percentage of the distance between the two. The levels work as zones of attention, not exact turning points.
Few technical analysis tools spark as much curiosity as Fibonacci lines. Could a sequence described more than 800 years ago help find support and resistance in today's market? The explanation is less mysterious: a lot of people watch these levels and act near them, which helps make them relevant.
In this guide we show where the levels come from, how to do the math, and what actually happened in two real 2026 moves: ether (ETH/USDT on Binance) and gold (the futures contract, Yahoo Finance).
What the Fibonacci retracement is
The Fibonacci sequence always adds the two previous numbers: 1, 1, 2, 3, 5, 8, 13, 21, 34... Dividing a number by the next one, the result approaches 0.618; dividing by a number two positions ahead, 0.382; three positions ahead, 0.236. These values produce the most used retracement levels: 23.6%, 38.2%, 50%, 61.8%, and 78.6%.
The 50% level doesn't come from the sequence, but it's used because it marks the halfway point of the move. The retracement measures how far a correction has pulled back relative to the previous leg: a 38.2% correction has given back 38.2% of what the price had moved.

How to calculate Fibonacci levels
Pick a clear up or down leg and mark its start and end points. On an up move, each level is: high − percentage × (high − low).
Example with real ether data
Between August 1, 2026 and August 27, 2026, ETH rose from a low of $1,822.06 to a high of $2,566.53. The leg measures 2,566.53 − 1,822.06 = $744.47.
- 23.6%: 2,566.53 − 0.236 × 744.47 = $2,390.84
- 38.2%: 2,566.53 − 0.382 × 744.47 = $2,282.14
- 50%: 2,566.53 − 0.5 × 744.47 = $2,194.30
- 61.8%: 2,566.53 − 0.618 × 744.47 = $2,106.45
- 78.6%: 2,566.53 − 0.786 × 744.47 = $1,981.38
Extensions project targets beyond the high, starting from the low: low + percentage × leg. The 127.2% extension lands at 1,822.06 + 1.272 × 744.47 = $2,769.03; the 161.8% one, at $3,026.61.
Real example: Fibonacci on ether and gold in 2026
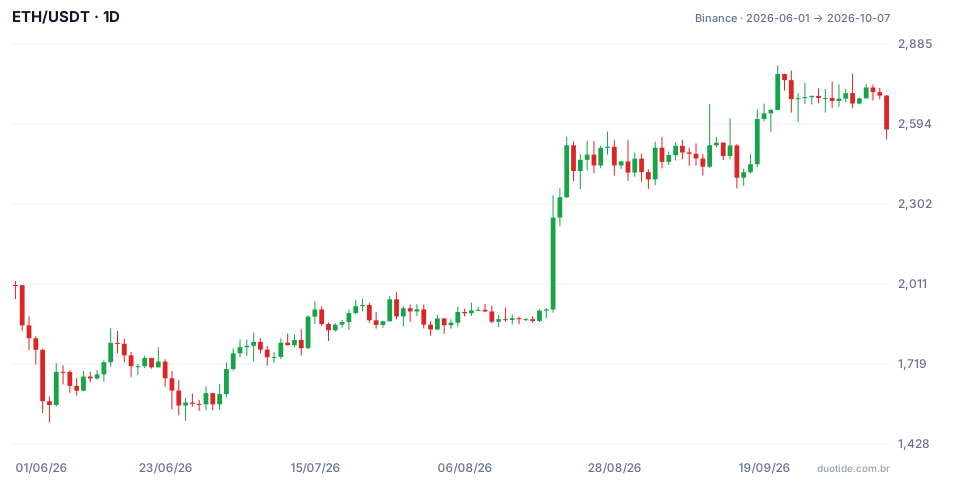
The chart shows ETH from June 1, 2026 to October 7, 2026. Over the period, the coin went from $2,006.73 to $2,574.14, with a low of $1,505.68 on June 6 and a high of $2,807.34 on September 21.
September: a shallow correction, near the 23.6%
After the August 27 high, ETH pulled back to a low of $2,356.41 on September 2, a 28.2% retracement, and closed the day at $2,391.92, practically right on the 23.6% level. The next day it rose 4.8%, to $2,507.51. On September 15 it touched the same region again (a low of $2,358.88) and held once more. Shallow corrections like this tend to show up in strong trends; the deeper levels never even got tested.
September 21: the 127.2% extension
After breaking above August's high on September 11, ETH reached $2,807.34 on September 21 and closed at $2,776.19, just above the 127.2% extension ($2,769.03). That was the period's high: by October 7 the close stood at $2,574.14, 7.3% lower. The extension pointed to a zone where the rally lost steam, but not an exact price.
Gold: a deep correction, down to the 78.6%
Gold rose from a low of $3,955.40 on June 30, 2026 to $4,755.00 on August 25. With a leg of $799.60, the 61.8% level sat at $4,260.85 and the 78.6% at $4,126.51. The correction blew straight through the 61.8% and reached a low of $4,143.10 on September 28, a 76.5% retracement. In the following sessions the price got squeezed between $4,130 and $4,260, and on October 7 the intraday low of $4,091.20 poked below the 78.6%. This is the case where a deep correction raises doubt about the original trend.

How to use Fibonacci lines
Choose the leg carefully
Use a clear move, visible on the daily or weekly chart, from low to high (or high to low). Small legs, made up of just a few candles, produce levels that almost no one watches.
Read the levels as zones
ETH held at $2,356, not at $2,390.84. Treat each level as a range and wait for the price to show a reaction (a rejection candle, a higher low) before acting.
Look for confluence
A Fibonacci level that coincides with an old support, a long moving average, or a round number tends to get more attention than the level on its own.
Use it to plan your risk
The levels help decide where to place the stop (below the next level) and where to take partial profit (at an extension). That's more useful than trying to predict the exact turning point.
Limitations
Two people rarely pick the same leg, and each choice generates different levels. With five levels on the screen, there's almost always one close to the price, which makes the tool look more accurate than it is. And the 61.8%, called the golden retracement, comes with no guarantee at all, as gold showed.
Common mistakes when using Fibonacci
- Redrawing the leg after the fact until the levels line up with the chart.
- Entering right when the level is touched, without waiting for any reaction from the price.
- Using Fibonacci on its own, without trend, support, resistance, or volume.
- Placing the stop exactly at the level, where a lot of people place theirs.
- Forgetting that the examples above describe what happened, not what will happen.
To practice, open the daily chart of an asset you follow on a demo account, draw the retracement on the most recent clear legs, and note which levels the price reacted to and which ones it blew through. After a few weeks, your own log shows how much the tool actually helps your style.
Practice before you risk. Open your Duotide account and test your ideas on the demo account with US$10,000 in virtual funds.
Create free accountUpdated:
Editorial character of the Duotide newsroom. Articles are written by the team with the help of artificial intelligence; prices and charts come from real market data. Explains charts, indicators and trading strategies: how they work, where they fail and how to test them first.
Was this article helpful?
Be the first to rate it.
Comments
- No comments yet. Be the first to comment.
Ready to put it into practice?
Open your account and practice on the demo account with US$10,000 in virtual funds, without risking money.
- Secure platformProtected login and identity verification
- Multilingual supportHelp available every day
- Free demo accountUS$10,000 virtual to practice
Trading involves the risk of losing the capital invested.
