

 Português pt
 Español es
 العربية ar
 বাংলা bn
 Deutsch de
 Filipino fil
 Français fr
 हिन्दी hi
 Bahasa Indonesia id
 Italiano it
 Русский ru
 Svenska sv
 ไทย th
 Türkçe tr
 Tiếng Việt vi
 简体中文 zh
Updated:
Technical analysisWhat Price Action Is and How to Use It in Practice
 Naomi TanakaEditorial character · Analysis Desk

Quick answer
Price action is reading the movement of the price itself, through candles, highs, lows, supports, and resistances, without relying on calculated indicators. The idea is to identify the market's structure (up, down, or sideways), wait for the price to reach a relevant region, and only then look for an entry signal, with the stop set beforehand. It's a way to organize probabilities, not to predict the future.
Before any indicator shows up on the screen, there's one piece of information all of them use as raw material: the price itself. Price action is the school of analysis that works directly from that source. Instead of averages, oscillators, and formulas, the trader watches candles, highs, lows, and the market's behavior at specific price regions.
In this guide, instead of a made-up example, we use real daily gold quotes (a futures contract traded in the United States, in dollars per ounce) between April and October 2026. It was a period with everything price action teaches you to read: a downtrend, a sideways range, a breakout, an uptrend, and a renewed loss of strength.
What Price Action Is
Price action is the analysis of the sequence of prices (the open, high, low, and close of each period) without relying on derived indicators, such as moving averages or the RSI. The logic is straightforward: every indicator is calculated from the price, with some lag, so it makes sense to study the price at its source.
That doesn't mean banning any tool. Many traders combine price action with support and resistance lines, volume, and a long moving average to filter the trend. The difference is that the decision is born from reading the chart's structure, not from a line crossover.
The Elements You Need to Recognize
- Candles: the size of the body and the wicks shows who dominated that period and where price was rejected.
- Highs and lows: progressively higher highs and lows define an uptrend; progressively lower ones, a downtrend; with no clear sequence, a sideways market.
- Support and resistance: regions where the price has reacted more than once in the past.
- Breakouts: closes outside a region that had been holding the price.
- Candle patterns: engulfing, hammer, star, and others, which only carry weight when they show up at a relevant point in the structure.

Real Example: Gold from April to October 2026
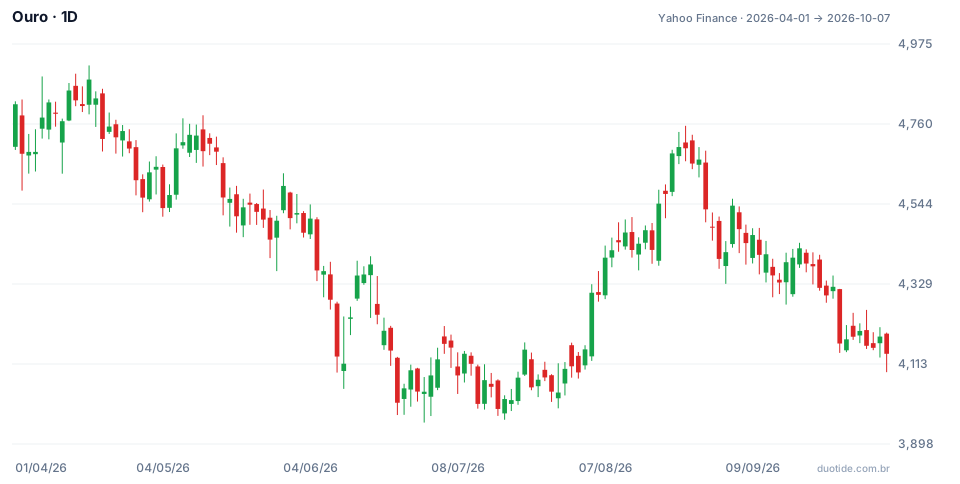
The chart above shows gold's 131 trading days over the period. The contract opened the window at $4,813.10 and closed on October 7, 2026 at $4,140.70, a 13.97% drop. The high was $4,917.70 on April 17 and the low, $3,955.40 on June 30. Between those two points, the structure tells the whole story.
April to June: Progressively Lower Highs and Lows
After the high of $4,917.70 on April 17, each bounce stopped lower: $4,783.40 on May 12, $4,627.10 on May 29, and $4,403.60 on June 17. The lows followed the same path: $4,510.10 on May 4, $4,363.50 on May 28, $4,046.20 on June 11, and $3,955.40 on June 30. That's the definition of a downtrend in price action, and it told anyone following it something useful: as long as the sequence wasn't broken, buying every dip meant rowing against the structure.
July: The Sideways Range and the August 5 Breakout
In July the sequence of lower lows stopped. The price started oscillating between the low of $3,955.40 (June 30) and the high of $4,215.50 (July 6). The floor was tested again on July 17, with a low of $3,963.00, and it held. On August 5 came a long bullish candle: opening at $4,133.80 and closing at $4,305.20, 3.67% above the previous day and above the top of the range. From there the lows started rising, and gold reached $4,755.00 on August 25, 10.4% above the breakout day's close.
One way to turn that read into a trade, with risk defined before the entry:
- Entry: at the breakout candle's close, at $4,305.20.
- Stop: below the range's old top, at $4,200.00. A risk of $105.20 per ounce.
- Target by the range's height: 4,215.50 − 3,955.40 = 260.10. Added to the broken top, that's $4,475.60. Potential gain of $170.40 per ounce.
- Risk-reward ratio: 170.40 ÷ 105.20 = 1.62.
In the real case, the lowest low between August 6 and August 11 was $4,281.20, above the stop, and the target was reached on August 11, when the high hit $4,495.00. This describes what happened in this specific breakout; many breakouts fail and fall back inside the range, and that's why the stop comes before the target.
August and September: Bullish Engulfing and a Renewed Loss of Strength
On August 18, gold opened at $4,473.40 and closed lower, at $4,420.60. The next day it opened lower, at $4,391.40, and closed at $4,545.30, with a body that fully covered the previous day's: a bullish engulfing pattern, which showed up inside an already confirmed uptrend. Two trading days later, the close stood at $4,680.60.
After the $4,755.00 high on August 25, the structure turned again. The following highs stopped at $4,558.50 (September 3) and $4,439.80 (September 18). September's lows found footing near $4,273.30 (September 16) and $4,278.30 (September 24), until on September 28 the price closed at $4,168.40, 3.54% below the previous day and below that support. On October 7 the close stood at $4,140.70.
How to Use Price Action
Start with the Structure, Not the Candle
Before looking for a signal, answer: are the recent highs and lows rising, falling, or moving sideways? In gold's May, a pretty hammer in the middle of a downtrend was worth little; the same pattern near July's range floor was worth more.
Mark Few Regions, the Ones the Price Has Respected
One or two lines per chart are enough. The best ones are those the price has tested more than once, like the floor from $3,955 to $3,963 in June and July.
Wait for the Price to Reach the Region
Most of the time, the price is in the middle of nowhere. Price action demands patience: the trade happens at the edge of the range, on the breakout or the retest, not on just any candle.
Set the Stop and Target Before Entering
The stop sits at the point that invalidates the read (below the broken top, for example). If the ratio between the possible target and the risk isn't worth it, the trade doesn't exist.
Limitations
The reading has a subjective part: two traders can mark different supports on the same chart. Candle patterns alone have a modest win rate, and false breakouts are common, especially on short minute charts. Price action organizes probabilities; it doesn't eliminate the risk.

Common Mistakes in Price Action
- Trading every reversal candle, even far from any support or resistance.
- Ignoring the bigger trend and buying lows in a clear sequence of falling highs and lows.
- Filling the chart with lines until any price looks like support.
- Entering a breakout without a stop, betting the price won't move back inside the range.
- Treating past examples as a guarantee: they describe what happened, not what will happen.
To train without risking money, open the daily chart of an asset in your demo account, mark the sequence of highs and lows and the two most tested regions, and log each read with date, entry, stop, and target before knowing the result. After a few dozen entries, you'll have your own data on what works for your style of trading.
Practice before you risk. Open your Duotide account and test your ideas on the demo account with US$10,000 in virtual funds.
Create free accountUpdated:
Editorial character of the Duotide newsroom. Articles are written by the team with the help of artificial intelligence; prices and charts come from real market data. Explains charts, indicators and trading strategies: how they work, where they fail and how to test them first.
Was this article helpful?
Be the first to rate it.
Comments
- No comments yet. Be the first to comment.
Ready to put it into practice?
Open your account and practice on the demo account with US$10,000 in virtual funds, without risking money.
- Secure platformProtected login and identity verification
- Multilingual supportHelp available every day
- Free demo accountUS$10,000 virtual to practice
Trading involves the risk of losing the capital invested.
