

 Português pt
 Español es
 العربية ar
 বাংলা bn
 Deutsch de
 Filipino fil
 Français fr
 हिन्दी hi
 Bahasa Indonesia id
 Italiano it
 Русский ru
 Svenska sv
 ไทย th
 Türkçe tr
 Tiếng Việt vi
 简体中文 zh
Updated:
Technical analysisPrice Action: Reading Candles with Trend, Support, Resistance
 Naomi TanakaEditorial character · Analysis Desk

Quick answer
Price action is reading the price's behavior directly on the chart, without relying on indicators. The same candle can mean opposite things depending on where it forms: a reversal signal at a support that's already been tested, aligned with the context, is worth far more than the same shape in the middle of nowhere. That's why the analysis starts with the trend and the support and resistance levels, and only afterward with the candle's shape.
It's common for a beginner to memorize the shape of a few candles and go hunting for those shapes on the chart, entering every time they show up. The problem is that the same candle, on the same asset, can mean completely different things depending on where it forms.
In this guide we use real daily gold quotes (futures contract, Yahoo Finance) between April 1, 2026 and October 7, 2026 to show how trend, support, and resistance turn an ordinary candle into a relevant signal, or take apart a signal that looked good.
What Price Action Is
Price action is analysis done directly from the price's own movement: the sequence of highs and lows, the regions where the market has reacted before, and the shape of the candles. Indicators can complement it, but the foundation is the bare chart.
A candle with a long lower wick shows that the price dropped and got rejected, with buyers pushing the close back up. That only carries weight in a place where that rejection makes sense. In the middle of a range, with no level nearby, it tends to be noise.

How to Read the Context Before the Candle
First Step: The Trend
Before looking for an entry signal, define the bigger picture from the sequence of highs and lows. Rising highs and lows indicate an uptrend; falling ones, a downtrend; with no clear sequence, the market is sideways. A signal against a strong trend demands stronger confirmation than a signal in its favor.
Second Step: Support and Resistance
The same reversal candle gains weight when it shows up in a region where the market has already reacted more than once. That shows other participants also see that level, which increases the chance of a similar reaction.
Third Step: The Candle and the Plan
Only then does the candle's shape enter the decision, along with the risk calculation: where the stop goes, where the target goes, and what the ratio between the two is.
Real Example: Price Action in Gold in 2026
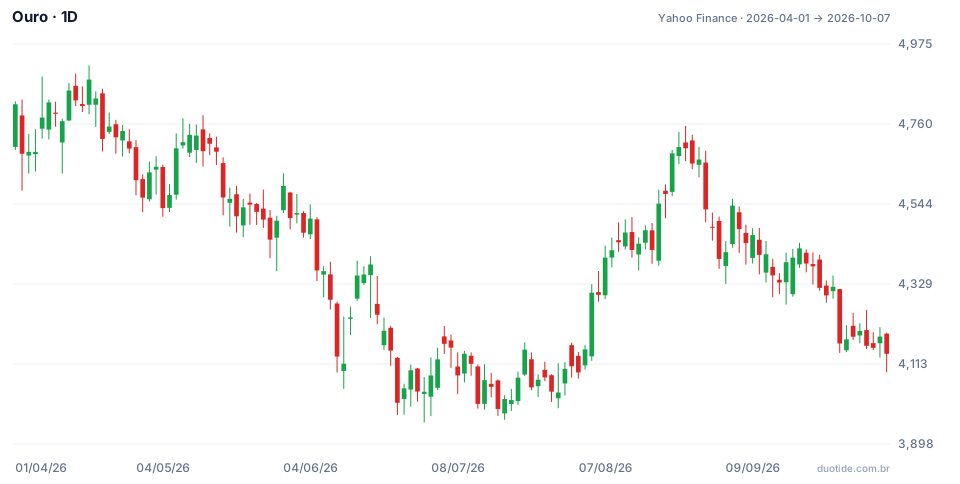
Over the period, gold went from $4,813.10 an ounce and closed on October 7 at $4,140.70, a 14% drop. The high was $4,917.70 on April 17 and the low, $3,955.40 on June 30. Between April and June, the downtrend was clear in the falling highs: $4,917.70 on April 17, $4,783.40 on May 12, and $4,627.10 on May 29. Four situations show the role of context:
May 28: A Hammer Against the Trend, Without Support
The May 28 candle opened at $4,453.60, fell to $4,363.50, and closed at $4,499.30, near the high: a lower wick of $90.10, twice the size of the body. By shape, a classic hammer. But it formed right after the price lost the $4,455-to-$4,467 region, which had held the declines of May 19 and 20. It was a broken support, not a defended one, inside a downtrend. Gold rose the next day, but on June 11 it closed at $4,114.00, 8.6% below the hammer's close.
July 17: The Same Type of Signal, in the Right Place
Between June 24 and July 17, gold tested the $3,955-to-$3,976 range at least five times: lows of $3,975.70 on June 24, $3,955.40 on June 30, $3,973.00 on July 1, $3,973.40 on July 16, and $3,963.00 on July 17. The lows had stopped falling. On July 17 the candle opened at $3,980.10, touched $3,963.00, and closed at $4,018.80, just $10.10 from the day's high. One possible plan, calculated before the entry:
- Entry at the close: $4,018.80
- Stop below the support, at $3,950.00: a risk of $68.80
- Target at the previous resistance, the July 6 high, at $4,215.50: a return of $196.70
- Risk-reward ratio: 196.70 ÷ 68.80 = 2.9 to 1
After that, the lowest low was $3,986.50, on July 20, never touching the stop. On August 5 the price rose to $4,328.20, passing the target. On August 21 gold closed at $4,680.60, 16.5% above the July 17 candle.
August: May's Resistance
The rally stopped at the same region that had been a peak in May, between $4,735 and $4,783. On August 24 the high was $4,738.50 and on August 25, $4,755.00. On August 28 the price fell 2.9% in one day, from $4,664.00 to $4,529.90. Anyone buying there, already near resistance and after a 16% rally, had little room and a lot of risk.
September: A Support That Gave Way
In September, the $4,273-to-$4,302 range held the lows on the 14th, 15th, 16th, 17th, 24th, and 25th. On September 28 gold closed at $4,168.40, a 3.5% drop on the day, below that range. A support tested many times also wears down: after the breakdown, the price never closed above $4,205 again through October 7.

How to Use Price Action
Volume and the Move's Distance Traveled
A reversal candle with above-average volume tends to reflect a real shift in strength. And an exhaustion signal after a long decline, like in July, makes more sense than the same signal right at the start of the move.
Plan Before the Entry
Set the stop and target by the chart's levels, not by a fixed amount. The stop goes beyond the support; the target, before the next resistance.
Limitations
The examples above describe what happened and don't guarantee the same context will produce the same result. Support and resistance are zones, not exact lines, and the read changes from one analyst to another. No combination of trend, level, and candle eliminates the risk of loss.
Common Mistakes When Reading Price Action
- Entering as soon as a familiar shape shows up, without checking the trend.
- Confusing a broken support with a defended one, as in the May 28 hammer.
- Buying right below a relevant resistance, with little room to the target.
- Thinking a support tested many times will hold forever.
- Calculating the stop and target after entering, instead of before.
- Ignoring the volume and the distance the move has already traveled.
To practice, open the daily chart of an asset in your demo account, mark the supports and resistances before looking at the candles, and note, for each signal, the context, the stop, the target, and the result. After a few weeks, your record will show which contexts worked for you.
Practice before you risk. Open your Duotide account and test your ideas on the demo account with US$10,000 in virtual funds.
Create free accountUpdated:
Editorial character of the Duotide newsroom. Articles are written by the team with the help of artificial intelligence; prices and charts come from real market data. Explains charts, indicators and trading strategies: how they work, where they fail and how to test them first.
Was this article helpful?
Be the first to rate it.
Comments
- No comments yet. Be the first to comment.
Ready to put it into practice?
Open your account and practice on the demo account with US$10,000 in virtual funds, without risking money.
- Secure platformProtected login and identity verification
- Multilingual supportHelp available every day
- Free demo accountUS$10,000 virtual to practice
Trading involves the risk of losing the capital invested.
