

 Português pt
 Español es
 العربية ar
 বাংলা bn
 Deutsch de
 Filipino fil
 Français fr
 हिन्दी hi
 Bahasa Indonesia id
 Italiano it
 Русский ru
 Svenska sv
 ไทย th
 Türkçe tr
 Tiếng Việt vi
 简体中文 zh
Updated:
Technical analysisSupport and Resistance: How to Use Them in Trading
 Naomi TanakaEditorial character · Analysis Desk

Quick answer
Support is a price band where buying tends to slow declines; resistance is a band where selling tends to slow rallies. They're identified from previous highs and lows and gain strength with the number of touches and time. Treat them as zones, not exact lines, and use a stop: in 2026, the Ibovespa's 188,500-to-189,500-point resistance held through five tests in September and broke on October 2.
If there's one concept every trader learns before any indicator, it's support and resistance. At certain price levels, buyers and sellers clash more visibly, and the price stops falling or rising. Identifying those levels and knowing what to do when the price gets near them takes more than drawing a line.
In this guide we use the Ibovespa's real daily quotes between March and October 2026 to show how these zones form, how they swap roles, and what happened in bounce and breakout trades.
What support and resistance are
Support is a price band where buying tends to overpower selling and slow down declines. Resistance is the opposite: a band where selling tends to overpower buying and slow down rallies. They form at previous highs and lows, where the price has already turned before, and also at round numbers, which concentrate buy and sell orders.
The most important point: support and resistance are zones, not exact lines. The price usually overshoots the level a little before reacting.

How to identify support and resistance
- Mark highs and lows on the daily chart of the past few months.
- Group the ones that sit close together: two or more touches within a narrow band form a zone.
- Weigh the number of touches and the time: a level tested several times over months counts for more than one tested over just a few days.
- Check for coincidences: long moving averages, round numbers, and old levels reinforce the zone.
Example with real Ibovespa data
In September 2026 the index hit the same band five times: highs of 188,892 points on September 3, 189,488 on September 8, 188,539 on September 10, 188,586 on September 11, and 188,772 on September 23. The gap between the highest and lowest of those touches is 949 points, about 0.5%: a resistance zone between 188,500 and 189,500 points.
On the downside, the 167,000-to-168,000-point band held the index twice: in June (lows of 167,916 on June 17, 167,911 on June 18, and 167,658 on June 19) and in August (167,142 on August 12 and 166,211 on August 18). On August 14 the low broke through the zone and reached 164,835, but the day's close came back to 166,934. It's the classic example of why to treat a level as a band.
Real example: the Ibovespa in 2026
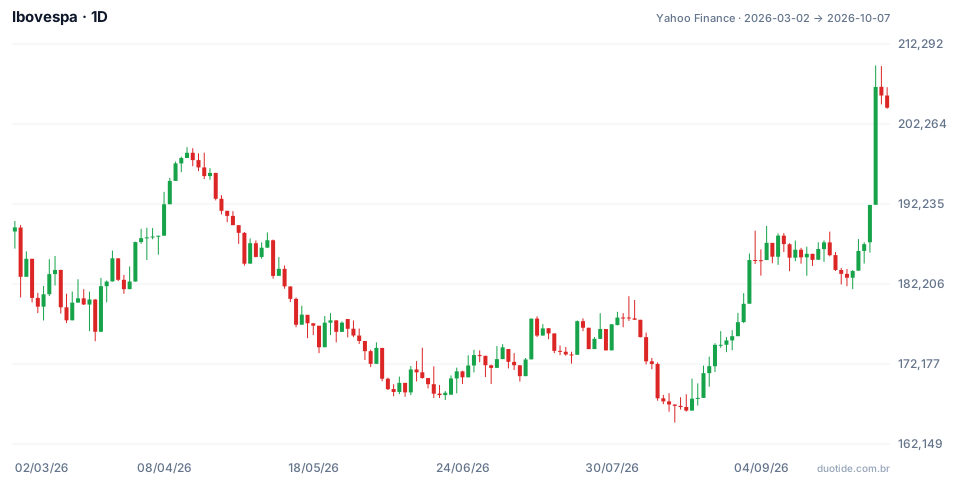
The chart shows the Ibovespa's daily candles from March 2 to October 7, 2026. Over the period, the index rose 7.92%, from 189,307 to 204,302 points, but went through a decline through August along the way. Three situations show the zones in action.
April: resistance that turned into support, then gave way
Between April 1 and April 6 the highs stopped near 189,200 points (189,131, 189,251, and 189,220). On April 8 the index broke through and closed at 192,201. In the correction that followed, the same band acted as support: lows of 189,963 on April 24 and 189,579 on April 27. On April 28 it gave way, and on April 29 the index closed at 184,750, 2.55% below the April 27 close. The role swap happened, but it lasted just two sessions.
August: a bounce off support
A long entered at the August 19 close, at 167,830 points, with a stop below the August 14 low, at 164,500, would risk 3,330 points (1.98%). With a target at 177,800, just below early August's highs (180,680 on August 4), the potential gain would be 9,970 points (5.94%), a ratio of 1 to 2.99. The stop was never touched and the target was reached on August 31, when the high hit 178,586.
October: breaking September's resistance
On October 2 the index rose 2.63% and closed at 192,115 points, clearly above the 188,500-to-189,500 zone. On October 5 the high reached 209,606, 9.10% above the breakout close, and on October 7 the index closed at 204,302, 6.34% above it. These examples describe what happened, not what will happen.

How to use support and resistance
Trading the bounce
Buy near a relevant support, with a stop a bit below the zone, or sell near a resistance, with a stop a bit above it. The target is usually the opposite zone. It works best in a sideways market and when the approach to the level is slow, with small candles.
Trading the breakout
Enter when the price closes clearly beyond the zone, ideally with volume above average. Using the close, not just the high or the low, lowers the chance of getting caught in a false breakout like August 14's, which snapped back the same day.
Role swaps
Broken resistance tends to turn into support, and broken support tends to turn into resistance, because those who missed the move tend to act when the price comes back to the level. As in April, the swap can be short-lived: the stop is still necessary.
Strength and wear
Each touch confirms the level, but it also uses up the orders that were sitting there. After many tests in a row, like September's five, the odds of a breakout tend to rise, not fall.
Limitations
Two people rarely draw the same zones. Support and resistance show where there was a reaction in the past, they don't guarantee a reaction in the future, and big news can cut through any level.
Common mistakes with support and resistance
- Treating the level as an exact line and bailing at the first small breach.
- Drawing so many lines that the chart loses any meaning.
- Trading a breakout off the day's high, without waiting for the close.
- Buying at support without a stop because the level held the other times.
- Ignoring the bigger trend when choosing between a bounce and a breakout.
To practice without risking money, mark the support and resistance zones of the asset you follow in a demo account, write down before each approach whether you're going for a bounce or a breakout, and record what happened. After a few weeks, your record will show which zones are worth watching in your market.
Practice before you risk. Open your Duotide account and test your ideas on the demo account with US$10,000 in virtual funds.
Create free accountUpdated:
Editorial character of the Duotide newsroom. Articles are written by the team with the help of artificial intelligence; prices and charts come from real market data. Explains charts, indicators and trading strategies: how they work, where they fail and how to test them first.
Was this article helpful?
Be the first to rate it.
Comments
- No comments yet. Be the first to comment.
Ready to put it into practice?
Open your account and practice on the demo account with US$10,000 in virtual funds, without risking money.
- Secure platformProtected login and identity verification
- Multilingual supportHelp available every day
- Free demo accountUS$10,000 virtual to practice
Trading involves the risk of losing the capital invested.
