

 Português pt
 Español es
 العربية ar
 বাংলা bn
 Deutsch de
 Filipino fil
 Français fr
 हिन्दी hi
 Bahasa Indonesia id
 Italiano it
 Русский ru
 Svenska sv
 ไทย th
 Türkçe tr
 Tiếng Việt vi
 简体中文 zh
Updated:
Technical analysisDoes technical analysis work in forex? What EUR/USD data shows
 Naomi TanakaEditorial character · Analysis Desk

Quick answer
Technical analysis works in forex as a method for organizing decisions and controlling risk, not as a way to predict price. It helps define entry, stop, and position size, but it generates many false signals in a sideways market and does not anticipate news like interest rate decisions. Only a record of your own results tells you whether a method works for you.
When it comes to currencies, opinions on technical analysis tend to go to extremes: for some, it is the foundation of any serious trading; for others, it is looking for shapes in noise. The data sits somewhere in between, and understanding exactly where helps avoid both overconfidence and giving up on the tool too soon.
Instead of opinion, this article uses real daily EUR/USD quotes (Yahoo Finance) between March and October 2026 to test a classic technical rule, show where it got it right and where it got it wrong, and turn chart reading into a risk calculation with pip value and the ATR.
What technical analysis does in forex
Technical analysis studies price and volume to organize decisions: where to enter, where to exit, where to accept being wrong. Moving averages, support and resistance, and indicators like the RSI and ATR do not predict the future; they turn the chart into rules that can be repeated and measured.
In forex, this matters even more. The market runs almost 24 hours a day, five days a week, and the major pairs move little in percentage terms. Without a method, the trader decides on impulse, in the middle of a news event or a sharp move, and with leverage a small price error turns into a large loss.

How to calculate pip value and position size
Before any signal, you need to know how much each move is worth. On EUR/USD, a pip is the fourth decimal place: 0.0001. Pip value depends on position size:
- Micro lot (1,000 euros): 0.0001 × 1,000 = $0.10 per pip.
- Mini lot (10,000 euros): 0.0001 × 10,000 = $1 per pip.
- Standard lot (100,000 euros): 0.0001 × 100,000 = $10 per pip.
Example using EUR/USD's real ATR
The 14-day ATR measures the pair's average daily range. On October 6, 2026, it stood at 65.4 pips, with EUR/USD at 1.1254. Suppose a $10,000 account willing to risk 1% per trade ($100), with a stop of 1.5 times the ATR, to stay clear of the day's normal back-and-forth:
- Stop = 1.5 × 65.4 = 98 pips.
- Maximum value per pip = $100 ÷ 98 = $1.02.
- Position size = 1.02 ÷ 0.10 = about 10 micro lots (10,000 euros), where a 98-pip stop costs $98.
The ATR does not stay still. On September 8, 2026, it stood at 47.3 pips; under the same rule, the stop would be 71 pips and the position could be 14 micro lots. On March 23, with the ATR at 97.7 pips, the stop would rise to 147 pips and the position would fall to 6 micro lots. The dollar risk stays the same; what changes is the position size.
Real example: moving averages on EUR/USD in 2026
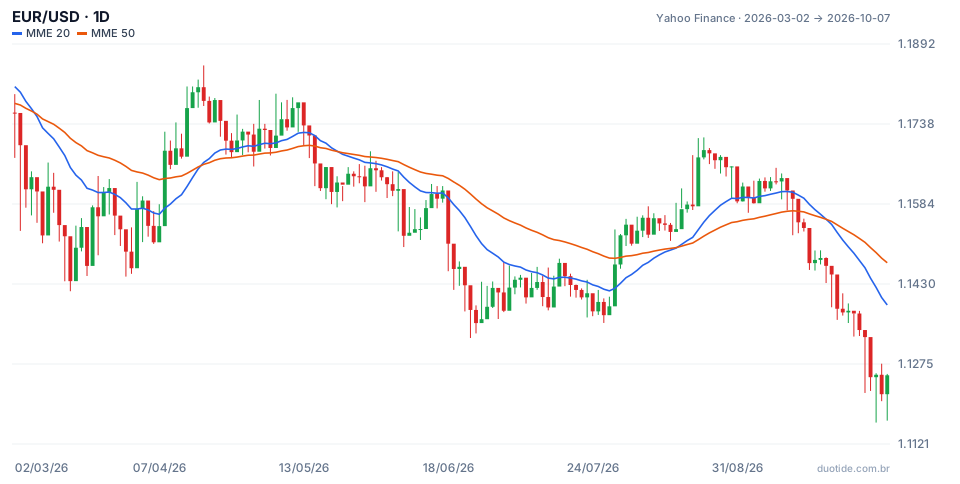
The chart shows the 20-day exponential moving average (blue) and the 50-day (orange). The rule tested is one of the best known: buy when the short average crosses above the long one and sell when it crosses below. During the period there were five crossovers, and their results say a lot about what technical analysis delivers.
March: the bearish signal arrived after the drop
On March 6, 2026, the 20-day average crossed below the 50-day, with the pair at 1.1608. The drop had already begun: on March 2, EUR/USD was at 1.1759. Ten trading sessions after the signal, the price was at 1.1578, only 0.26% lower. Moving averages confirm moves that have already happened.
April to July: signals in the middle of sideways ranges
The bullish crossover came on April 16, at 1.1783, after the pair rose 2.1% from 1.1541 on April 6. It was practically the top: the period's high, 1.1851, came on that same day, and ten trading sessions later the price was 0.46% lower. The next bearish crossover, on May 21 at 1.1621, was followed by ten sideways sessions (−0.07%). In both cases the market was moving in a narrow range, the environment where moving-average crossovers fail the most.
September: the signal that worked
On September 22 the 20-day average crossed below again, with EUR/USD at 1.1448. This time there was follow-through: ten trading sessions later, on October 6, the pair was at 1.1254, down 1.7%, and the period's low, 1.1162, came within that same stretch. In pips, that was about 194 pips between the signal and the October 6 close.
Summary of the five signals: one produced a meaningful move, one was slightly favorable (the August one, +0.13% over ten sessions), and three were neutral or against. That is the typical picture of a trend-following rule: few big wins, many small or wrong signals. A trader who doesn't control position size won't survive the losses long enough to be there for the win.

How to use technical analysis in forex
First identify the type of market
Before applying a signal, ask whether the pair is trending or ranging. Between June 25 and July 28, 2026, EUR/USD closed every day between 1.1361 and 1.1471; trend-following rules struggle in that environment, and range rules (buy near support, sell near resistance) make more sense. Indicators like the ADX help with that screening.
Respect the economic calendar
Interest rate decisions from the Fed and the ECB, and inflation and employment data in the United States and the eurozone, move currencies with a force no indicator anticipates. Many technical traders simply avoid opening positions near those times, or reduce their size.
Use few tools and written rules
Stacking the RSI, MACD, Bollinger Bands, and three moving averages on the same screen generates contradictory signals, and the trader ends up picking whichever one confirms what they already wanted to do. One tool for the trend, one for entry timing, and the ATR for the stop is usually enough.
Measure your own results
The question "does it work?" only has an answer backed by data. Record every trade: setup, reason, entry, stop, exit, and result in pips. After a few dozen records, you can see whether the pattern works on your pair, at your time of day, and on your timeframe.
Limitations
Every technical tool is calculated from past price, so it lags. Weekend gaps and news can push the price past the stop, and the cost of spread and swap weighs more heavily on traders who trade often. Technical analysis improves the quality of decisions, but it does not eliminate risk, and past results do not guarantee future ones.
Common mistakes when using technical analysis in forex
- Treating a moving-average crossover or an RSI level as an automatic order, without checking whether the market is ranging.
- Ignoring the economic calendar and getting caught off guard by an interest rate decision.
- Setting the stop based on the dollar loss you're willing to accept, rather than the pair's volatility, and then adjusting the position size backwards.
- Using the same number of micro lots with the ATR at 47 and at 98 pips, doubling the risk without noticing.
- Filling the screen with indicators and picking only the signal that's convenient.
- Judging a method by three or four trades, when most trend-following rules have more weak signals than strong ones.
- Reading the examples above as a forecast: they describe what happened to EUR/USD in 2026, not what will happen.
To practice without risking money, open EUR/USD's daily chart on a demo account, add the 20- and 50-day exponential moving averages and the 14-day ATR, calculate the position size before each entry, and record the result in pips for each signal. After a few weeks, your own numbers will answer better than any opinion whether technical analysis works for you.
Practice before you risk. Open your Duotide account and test your ideas on the demo account with US$10,000 in virtual funds.
Create free accountUpdated:
Editorial character of the Duotide newsroom. Articles are written by the team with the help of artificial intelligence; prices and charts come from real market data. Explains charts, indicators and trading strategies: how they work, where they fail and how to test them first.
Was this article helpful?
Be the first to rate it.
Comments
- No comments yet. Be the first to comment.
Ready to put it into practice?
Open your account and practice on the demo account with US$10,000 in virtual funds, without risking money.
- Secure platformProtected login and identity verification
- Multilingual supportHelp available every day
- Free demo accountUS$10,000 virtual to practice
Trading involves the risk of losing the capital invested.
