

 Português pt
 Español es
 العربية ar
 বাংলা bn
 Deutsch de
 Filipino fil
 Français fr
 हिन्दी hi
 Bahasa Indonesia id
 Italiano it
 Русский ru
 Svenska sv
 ไทย th
 Türkçe tr
 Tiếng Việt vi
 简体中文 zh
Updated:
Technical analysisTrend Continuation Patterns: Flag, Triangle, and Rectangle
 Naomi TanakaEditorial character · Analysis Desk

Quick answer
Trend continuation patterns are pauses in the middle of a move, such as flags, pennants, triangles, and rectangles, after which the price tends to keep going in the same direction. They're confirmed on the breakout of the consolidation, preferably with a volume increase. The target is usually measured by the pattern's height or the prior move, but it's a reference: the breakout can fail and the move can stop short of it.
No trend moves in a straight line. After a strong push, the price usually stops, oscillates in a narrow range, and only then decides its next step. These pauses form recurring shapes that technical analysis calls continuation patterns, because, in most textbooks, the expected exit is in the same direction as the prior move.
In this guide we explain the main patterns, how to measure the target, and we show a real case with daily ether quotes (ETH/USDT on Binance) between July and October 2026, with the dates, the prices, and what happened after each breakout.
What a Trend Continuation Pattern Is
It's a consolidation that shows up in the middle of an already established trend. Three elements repeat across all types:
- A strong prior move, called the flagpole in flags and pennants.
- A consolidation with a smaller range and, generally, lower volume than the push.
- A breakout of the consolidation in the trend's direction, ideally with higher volume.
Flag
After a nearly vertical flagpole, the price forms a small channel that tilts slightly against the trend: downward in an uptrend, upward in a downtrend. It usually lasts from a few days to a few weeks.
Pennant
Similar to the flag, but the consolidation takes the shape of a small symmetrical triangle, with descending highs and ascending lows converging.
Triangles
Longer than pennants. The ascending triangle has horizontal resistance and rising lows, and is read more as a bullish continuation; the descending one is its mirror; the symmetrical one has no bias and depends on the side of the breakout.
Rectangle
The price oscillates between a horizontal support and resistance. It indicates a temporary balance between buyers and sellers; the breakout of one of the lines defines the direction.

How to Calculate the Target of a Continuation Pattern
The most used technique is the measured move, in two versions:
- By the pattern's height (rectangles and triangles): target = breakout point ± the consolidation's height.
- By the flagpole (flags and pennants): target = breakout point ± the size of the prior move.
Example with Real Ether Numbers
Between August 18, 2026 and August 21, 2026, ETH rose from $1,917.85 to $2,516.30, a 31.2% gain in three days. From August 22 to September 17, the closes stayed between $2,391.92 (September 2) and $2,525.93 (September 12).
- Consolidation height = 2,525.93 − 2,391.92 = $134.01
- Target by height = 2,525.93 + 134.01 = $2,659.94
- Flagpole size = 2,516.30 − 1,917.85 = $598.45
- Target by flagpole = 2,525.93 + 598.45 = $3,124.38
The two methods give very different references. The flagpole target is the one most cited in textbooks, and also the one most often left unreached.
Real Example: Ether's Consolidation in 2026
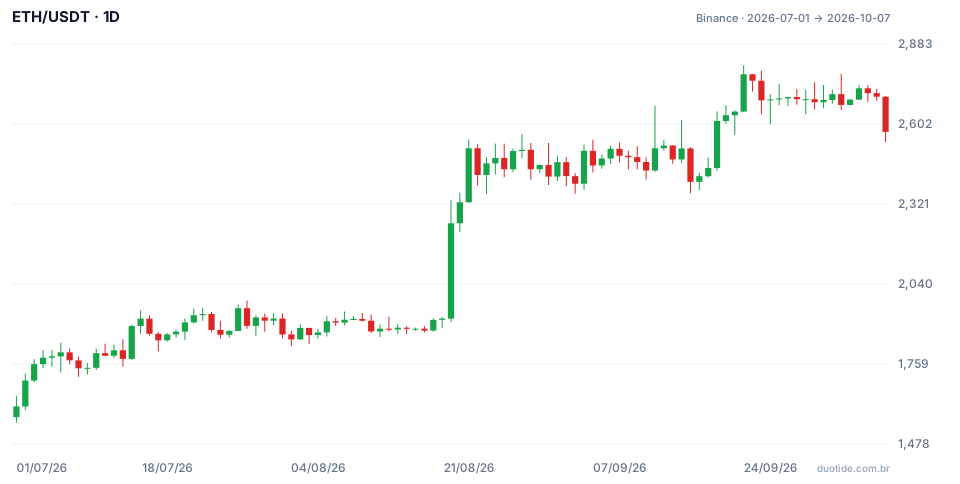
Over the chart's period, ETH goes from $1,609.58 on July 1, 2026 and closes on October 7, 2026 at $2,574.14, a 59.9% gain, with a high of $2,807.34 on September 21. Three moments show how the consolidation behaved.
August: A Push with Volume, a Pause Without It
Average daily volume was 730,000 ETH over the three flagpole days (August 19 to 21), against 183,000 in the prior month. During the 27-day consolidation, it dropped to 313,000. That's the classic behavior: a lot of participation on the push, less on the pause. The shape ended up closer to a rectangle than a flag, because the closes didn't form a tilted channel.
September 11: A Breakout That Didn't Close
On September 11 the day's high reached $2,665.99, well above the top of the range, with volume of 639,000 ETH. The close, however, was $2,516.43, back inside. Four days later, on September 15, the price closed at $2,398.26, near the bottom of the rectangle. Anyone who entered on the intraday breakout got a scare; anyone who waited for the close didn't enter.
September 18 to 21: Confirmed Breakout
On September 18, ETH closed at $2,612.14, above $2,525.93, with volume of 507,000 ETH. On September 21 it closed at $2,776.19, already above the height target ($2,659.94). The flagpole target of $3,124.38 was never reached: after September 21 the price formed a new narrow range and, on October 7, closed at $2,574.14, 7.3% below September 21. The pattern worked by the conservative measure, not the optimistic one.

How to Use Trend Continuation Patterns
Confirm the Trend Before the Pattern
Without a clear prior move, a sideways range is just a sideways range. A continuation pattern depends on there being something to continue.
Wait for the Close Outside the Consolidation
As on September 11, intraday highs and lows often break the lines without the candle closing outside them. Using the close as confirmation reduces false signals, at the cost of entering a bit later.
Look at the Volume
Lower volume in the consolidation and higher volume on the breakout reinforce the read. A breakout on weak volume deserves more suspicion.
Set the Stop and Target Beforehand
A common stop reference is on the other side of the consolidation, or in its middle, for wide patterns. In the example, a stop below $2,391.92 for an entry at $2,612.14 meant risking $220.22 per ETH, against a $47.80 distance to the height target, which the price was already close to reaching. Doing this math beforehand helps decide whether the trade is worth it.
Limitations
The patterns are subjective: the same stretch can be read as a flag, a rectangle, or nothing at all. The target measure is a convention, not a property of the market. And any consolidation can break out against the trend, which turns a continuation pattern into a reversal pattern.
Common Mistakes with Continuation Patterns
- Calling any sideways range a continuation pattern, without a strong move before it.
- Entering on the intraday breakout without waiting for the candle's close.
- Using the flagpole target as if it were certain and holding the position waiting for it.
- Ignoring volume, both in the consolidation and on the breakout.
- Trading without a stop because the trend looks strong.
- Forgetting that the example above describes what happened, not what will happen.
To practice, look for consolidations after strong moves on the daily chart of assets you follow in your demo account. Note down the pattern type, the breakout point, the stop, both targets, and what happened. After a few entries you'll know which target measure comes closer to the real behavior of your market.
Practice before you risk. Open your Duotide account and test your ideas on the demo account with US$10,000 in virtual funds.
Create free accountUpdated:
Editorial character of the Duotide newsroom. Articles are written by the team with the help of artificial intelligence; prices and charts come from real market data. Explains charts, indicators and trading strategies: how they work, where they fail and how to test them first.
Was this article helpful?
Be the first to rate it.
Comments
- No comments yet. Be the first to comment.
Ready to put it into practice?
Open your account and practice on the demo account with US$10,000 in virtual funds, without risking money.
- Secure platformProtected login and identity verification
- Multilingual supportHelp available every day
- Free demo accountUS$10,000 virtual to practice
Trading involves the risk of losing the capital invested.
