

 Português pt
 Español es
 العربية ar
 বাংলা bn
 Deutsch de
 Filipino fil
 Français fr
 हिन्दी hi
 Bahasa Indonesia id
 Italiano it
 Русский ru
 Svenska sv
 ไทย th
 Türkçe tr
 Tiếng Việt vi
 简体中文 zh
Updated:
BeginnersWhat Is a Trading Signal and How to Tell If It Works
 Marina CostaEditorial character · Beginner's Guide

Quick answer
A trading signal is an objective rule that points to a possible buy or sell moment, like two moving averages crossing or the RSI leaving an extreme zone. The signal by itself guarantees nothing: it only has value if it's been tested, if it comes with a defined stop and target, and if the average result of the trades, adding up gains and losses, is positive.
Anyone starting to study the market quickly runs into groups, apps, and indicators that promise to tell them the right moment to enter. At bottom, they all deliver the same thing: signals. Understanding what a signal is, where it comes from, and how to measure whether it's any good is what separates someone who uses signals as a tool from someone who just follows tips.
In this guide we use a classic signal, the crossover of the 9- and 21-period exponential moving averages, applied to Apple's real daily quotes (AAPL) between March and October 2026. That way you can see, with numbers, how the same signal can look great or mediocre depending on how you measure it.
What a Trading Signal Is
A signal is a verifiable condition that, when it occurs, suggests an action. The key word is verifiable: two people looking at the same chart need to agree on whether the signal showed up or not. That rules out phrases like the price looks strong and includes rules like the 9-period average crossed above the 21-period one on the daily close.
Technical Signals
These come from price and volume: a moving-average crossover, the RSI below 30, a break above a high, a candle pattern. They're the most common because they're easy to automate and to backtest.
Fundamental Signals
These come from economic or company data: quarterly earnings beating expectations, a rate decision, an employment report. They tend to play out over longer timeframes and are harder to turn into an exact rule.
Third-Party Signals
These are alerts sent by analysts, communities, or paid services. The problem isn't the source, it's the lack of information: you almost always get the entry, but not the rule, the full track record, or the result of the losing trades.

Real Example: the Moving-Average Crossover on Apple in 2026
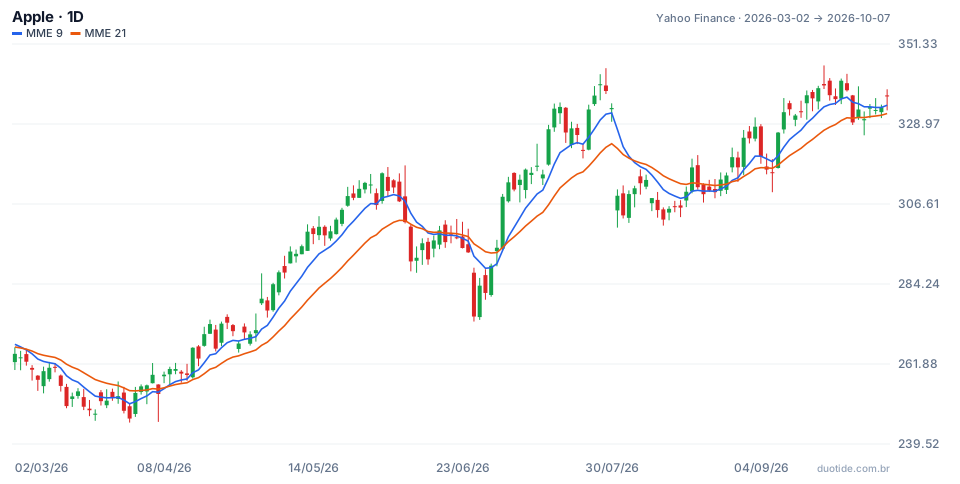
The chart shows Apple's closing price with the 9-day exponential average (blue) and the 21-day (orange). The rule is simple: when the 9-day crosses above the 21-day, it's a buy signal; when it crosses below, a sell signal. Between 03/02/2026 and 10/07/2026 the stock went from $264.72 to $336.67, up 27.2%, and the signal showed up six times.
Measuring by the Next 10 Sessions
A common way to promote signals is to show what the price did right afterward. By that measure, the crossover looks excellent:
- 03/04, sell at $262.52: ten sessions later the stock was 4.8% lower.
- 04/09, buy at $260.49: ten sessions later, 5.0% higher.
- 06/12, sell at $291.13: ten sessions later, 3.2% lower.
- 07/06, buy at $312.66: ten sessions later, 4.5% higher.
- 08/05, sell at $311.00: ten sessions later, 1.9% higher, meaning it missed.
- 08/28, buy at $319.70: ten sessions later, 4.2% higher.
Five out of six right. It looks like an almost perfect signal, and that's how many services present their own numbers.
Measuring It as a Real Trade
In practice, anyone following the signal stays long until the next sell signal and short until the next buy signal. Redoing the math per share, with the same closing prices:
- Sell on 03/04 at $262.52, exit on 04/09 at $260.49: a $2.03 gain.
- Buy on 04/09 at $260.49, exit on 06/12 at $291.13: a $30.64 gain.
- Sell on 06/12 at $291.13, exit on 07/06 at $312.66: a $21.53 loss.
- Buy on 07/06 at $312.66, exit on 08/05 at $311.00: a $1.66 loss.
- Sell on 08/05 at $311.00, exit on 08/28 at $319.70: an $8.70 loss.
- Buy on 08/28 at $319.70, still open on 10/07 at $336.67: a $16.97 paper gain.
Now it's three gains and three losses. The sum is positive, $17.75 per share, but almost all of the result came from a single trade (the April buy). And the 06/12 sell, which by the 10-session measure looked like a 3.2% win, ended up a 7.4% loss, because the price rose again before the opposite signal showed up. Same signal, same period, two very different conclusions. That's why the right question is never how many times the signal was right, but how much it made, adding everything up, the way you'd actually trade it.
How to Evaluate a Signal
Calculate the Expectancy
The measure that sums up a signal is expectancy per trade: (win rate × average gain) − (loss rate × average loss). In the Apple example, the win rate was 50%, the average gain was (2.03 + 30.64 + 16.97) ÷ 3 = $16.55, and the average loss was (21.53 + 1.66 + 8.70) ÷ 3 = $10.63. The expectancy comes out to 0.5 × 16.55 − 0.5 × 10.63 = $2.96 per share per trade, before costs. Positive, but with six trades it's too small a sample to conclude anything.
Demand a Reasonable Sample
Six trades fit well within chance. Before trusting a signal, look for at least 30 to 50 occurrences, preferably across more than one asset and in different market phases (up, down, and sideways).
Include the Costs
Spread, commissions, and slippage come out of every trade. A signal that generates many small entries can have a positive expectancy on paper and a negative one in the account.
Define the Exit Before the Entry
Every signal needs to come with three things: where to enter, where to accept you were wrong (the stop), and where or how to take profit. Without a stop, the 06/12 sell in the example could have turned into a much bigger loss if the rally had continued.
Limitations
Average-based signals work best in a trend and struggle in a sideways market, when crossovers repeat and generate a string of small losses, as in July and August on Apple. No signal adapts on its own to unexpected news, and a good result in the past doesn't guarantee the same result in the future.

Common Mistakes When Following Trading Signals
- Judging a signal by its win rate and ignoring the size of the gains and losses.
- Trusting screenshots of winning trades with no full track record, with the date and time of each signal.
- Following a signal without knowing the rule that generated it, which makes it impossible to know when it stopped working.
- Entering with no defined stop because the signal looked strong.
- Testing on a handful of trades and drawing definitive conclusions.
- Forgetting that the examples above describe what happened, not what will happen.
To practice without risking money, pick a simple signal, apply it in a demo account, and log every occurrence in a spreadsheet: date, entry price, stop, exit, and result. After a few dozen entries, calculate the expectancy. That number, not the impression of the day, is what shows whether the signal deserves a place in your trading.
Practice before you risk. Open your Duotide account and test your ideas on the demo account with US$10,000 in virtual funds.
Create free accountUpdated:
Editorial character of the Duotide newsroom. Articles are written by the team with the help of artificial intelligence; prices and charts come from real market data. Answers the first questions of those just starting out: account, platform, basic concepts and common mistakes.
Was this article helpful?
Be the first to rate it.
Comments
- No comments yet. Be the first to comment.
Ready to put it into practice?
Open your account and practice on the demo account with US$10,000 in virtual funds, without risking money.
- Secure platformProtected login and identity verification
- Multilingual supportHelp available every day
- Free demo accountUS$10,000 virtual to practice
Trading involves the risk of losing the capital invested.
