

 Português pt
 Español es
 العربية ar
 বাংলা bn
 Deutsch de
 Filipino fil
 Français fr
 हिन्दी hi
 Bahasa Indonesia id
 Italiano it
 Русский ru
 Svenska sv
 ไทย th
 Türkçe tr
 Tiếng Việt vi
 简体中文 zh
Updated:
Strategies10 Trading Strategies to Test: How They Work
 Naomi TanakaEditorial character · Analysis Desk

Quick answer
There's no trading strategy that works for everyone: the most common ones fall into trend (moving average crossover, breakout, pullback), reversal (RSI, sideways range, divergence), short-term (scalping, market open), and long-term (swing trading, fixed risk). To compare two strategies, look at the expected result per trade, not just the win rate, and test each one with fixed rules in a demo account before using real money.
There is no trading strategy that works for everyone. The time you have to watch the chart, the size of your account, and your tolerance for a losing streak completely change which approach makes sense. So instead of searching for the perfect strategy, it pays to get to know the most common ones, understand the logic behind each, and test a few with written rules.
Below are ten well-known strategies, grouped by the idea behind them. To avoid staying purely theoretical, we used real daily quotes from the S&P 500 between February and October 2026 to show how one of them, the moving average crossover, actually played out.
What a trading strategy is
A strategy is a set of rules that defines, before the trade, when to enter, where to exit at a loss, where to exit at a profit, and how much to risk. If any of those four parts depends on how you feel in the moment, it isn't a strategy yet: it's an opinion about the chart. The difference matters because only fixed rules can be tested and compared.

The 10 strategies, grouped by logic
Trend strategies
- 1. Moving average crossover: goes long when a short average crosses above a longer one and exits on the opposite crossover. Simple to test, but lagging by nature.
- 2. Breakout: enters when price closes above a resistance or below a support that had been respected, betting on continuation.
- 3. Trend pullback: waits for the trend to form and enters on the pullback, near an average or a support, with a tighter stop than on a breakout.
Reversal strategies
- 4. Mean reversion with RSI: looks for extremes (RSI very high or very low) and bets on price returning toward the average.
- 5. Sideways range: buys near support and sells near resistance while price oscillates inside a range.
- 6. Divergence: watches for when price makes a new high but the indicator doesn't follow, a sign of fading momentum.
Short-term strategies
- 7. Scalping: seeks small gains on trades lasting a few minutes. Depends on low costs and fast execution.
- 8. Market open: concentrates entries in the first minutes after the open, when volume and volatility tend to be higher.
Longer-term strategies
- 9. Event-driven swing trading: holds positions for days or weeks to capture the move after company earnings or interest rate decisions.
- 10. Fixed risk per trade: more a method than an entry signal. Always risks the same small fraction of the account, whatever the setup, and can be combined with any of the other nine.
How to calculate whether a strategy is worth it
Win rate alone is misleading. What matters is the expected result per trade: (win rate × average gain) − (loss rate × average loss). An example with round numbers, just to show the math:
- Strategy A: wins 65% of the time, gains R$ 40 on average and loses R$ 45 on average. Expected result = 0.65 × 40 − 0.35 × 45 = 26 − 15.75 = R$ 10.25 per trade.
- Strategy B: wins 40% of the time, gains R$ 120 on average and loses R$ 40 on average. Expected result = 0.40 × 120 − 0.60 × 40 = 48 − 24 = R$ 24 per trade.
Strategy B loses more often than it wins, and still has an expected result more than double that of A. To run this math with your own numbers, you need at least 30 to 50 trades logged under the same rule; with fewer than that, luck weighs too much.

Real example: moving average crossover on the S&P 500
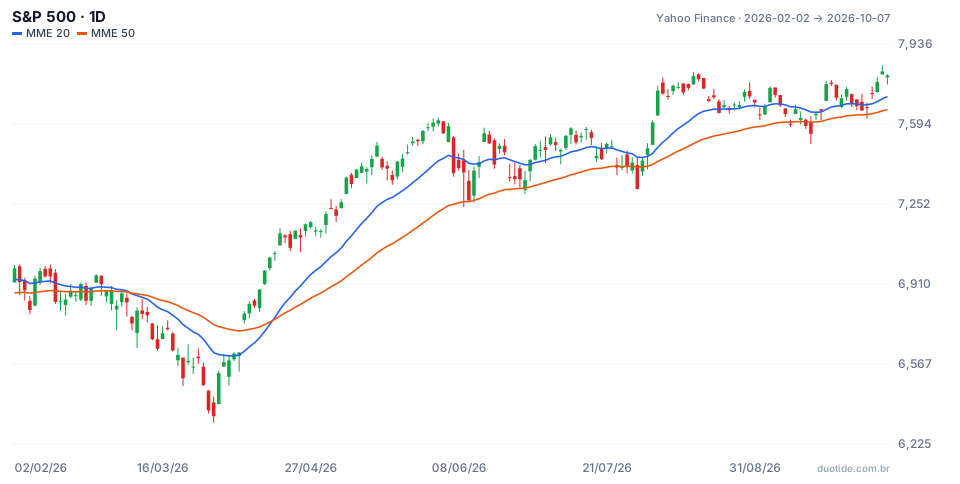
The chart shows the S&P 500 from February 2, 2026 to October 7, 2026 with two exponential moving averages: the 20-day (blue) and the 50-day (orange). Over the period, the index went from 6,976.44 to 7,801.77 points, a gain of 11.83%. The 20-day crossed the 50-day only twice.
March: the bearish crossover came after the drop had started
On March 6 the 20-day average crossed below the 50-day with the index at 6,740.02, already 3.4% below the February 2 close. Over the next 10 sessions the index fell another 3.46%, to 6,506.48, and the period's low came on March 30, at 6,316.91. Anyone following the rule would have avoided part of the drop, but not its start.
April: the bullish crossover came after the bottom
On April 16 the 20-day average crossed back above the 50-day, with the index at 7,041.28. By that point the price was already 11.0% above the March 30 close (6,343.72). In other words, the signal missed a double-digit rally. In exchange, anyone who entered there stayed positioned until the end of the series, when the index closed at 7,801.77, 10.8% above the entry point.
July: the pullback that served its purpose
On July 29 the index closed at 7,316.15, below the 50-day average (7,409.30), without the 20-day average crossing below it. For strategy 3, the pullback, that was exactly the kind of pullback being sought. By August 7 the index was already at 7,757.64, 6.0% higher. These are examples of what happened in this period; they don't indicate what will happen next.
How to use and test these strategies
Choose by market type
Trend strategies (1 to 3) work best when price is moving in one direction, as the S&P 500 did from April to October. Reversal strategies (4 to 6) work best in sideways ranges and tend to lose money in strong trends. Before testing, define how you'll recognize each type of market.
Choose by your available time
Scalping and trading the market open require being in front of the screen at the right time. Moving average crossovers and swing trading on the daily chart fit into a once-a-day review, after the close.
Test one at a time
Pick two or three, write down the rules, and test each one separately, with the same risk per trade. Mixing strategies in the same period makes it impossible to know which one produced the result.
Limitations
Every test uses past prices. Averages lag, breakouts fail, reversals turn into trends. Brokerage costs and the gap between the requested price and the executed price eat into the result, especially in short-term strategies, which make many trades.
Common mistakes when choosing a strategy
- Choosing based on win rate alone, without looking at the size of the gains and losses.
- Switching strategies after three or four losses in a row, before having a sample that says anything.
- Using a reversal strategy in a strongly trending market, or a trend strategy in a sideways market.
- Testing with vague rules, like entering whenever it looks good, which change with every trade.
- Ignoring costs and slippage in scalping.
- Assuming the result from one period, like the S&P 500's in 2026, will repeat identically in the next.
To practice without risking money, pick one of the ten strategies, write down the entry, stop, target, and risk rules, and apply it in a demo account for a few weeks. Log every trade with the date, asset, result, and reason for the entry, and only then calculate the expected result. That record is what shows whether the strategy fits you.
Practice before you risk. Open your Duotide account and test your ideas on the demo account with US$10,000 in virtual funds.
Create free accountUpdated:
Editorial character of the Duotide newsroom. Articles are written by the team with the help of artificial intelligence; prices and charts come from real market data. Explains charts, indicators and trading strategies: how they work, where they fail and how to test them first.
Was this article helpful?
Be the first to rate it.
Comments
- No comments yet. Be the first to comment.
Ready to put it into practice?
Open your account and practice on the demo account with US$10,000 in virtual funds, without risking money.
- Secure platformProtected login and identity verification
- Multilingual supportHelp available every day
- Free demo accountUS$10,000 virtual to practice
Trading involves the risk of losing the capital invested.
