

 Português pt
 Español es
 العربية ar
 বাংলা bn
 Deutsch de
 Filipino fil
 Français fr
 हिन्दी hi
 Bahasa Indonesia id
 Italiano it
 Русский ru
 Svenska sv
 ไทย th
 Türkçe tr
 Tiếng Việt vi
 简体中文 zh
Updated:
StrategiesBest Indicators for Day Trading: Moving Averages, VWAP, RSI, ATR, and Volume
 Naomi TanakaEditorial character · Analysis Desk

Quick answer
The best indicators for day trading form a lean set: 9- and 21-period exponential moving averages for direction, VWAP as the day's average price, one oscillator (RSI or stochastic, not both) for timing, the ATR for the stop and position size, and volume to confirm strength. More indicators than that tend to repeat information and slow down the decision.
Day traders open and close trades on the same day. Decisions are fast and repeated, and filling the screen with indicators tends to get in the way more than it helps. What works is having a few tools, well understood, each one answering a different question.
In this guide you'll see which indicators form a lean set for day trading, what each one does, and what they showed in real Nvidia prices from April to October 2026, including the times they got it wrong.
What a day-trading indicator needs to do
In day trading, every trade goes through four questions: which way to trade, where the day's fair price sits, when to enter, and where the stop goes. A fifth, optional question is whether there's real participation behind the move. The indicators below each answer one question:
- 9- and 21-period exponential moving averages: short-term direction.
- VWAP: reference for the day's average price.
- RSI or stochastic (just one): entry timing.
- ATR: stop distance and position size.
- Volume: strength of the move.

The indicators, one by one
9- and 21-period exponential averages
The exponential average gives more weight to recent prices and reacts faster than the simple average, which matters when the decision gets made in minutes. With the 9-period average above the 21-period one, the short-term bias is bullish; when it crosses below, the bias changes.
VWAP
The VWAP is the volume-weighted average price since the session opened. Price above the VWAP shows that, on average, anyone who bought that day is in profit; below it, in a loss. Many day traders avoid buying far above it or selling far below it, because the odds of the price reverting to the average are higher. The VWAP only exists on the intraday chart and resets every day.
A momentum oscillator
Once the direction is set, the RSI or the stochastic helps avoid buying at the top of a short bounce. A pullback of the RSI into the 40-to-50 range within an uptrend tends to be a better entry point than the moment it passes 70. Use just one: the RSI and the stochastic together repeat the same information.
ATR
The ATR (Average True Range) measures the asset's average swing on the chart's time frame. It doesn't indicate direction; it's used to place the stop outside the normal noise and to calculate how many shares or contracts to trade.
Volume
A breakout with above-average volume has more people behind it than the same breakout with weak volume. Volume doesn't guarantee continuation, but it helps separate a move with real participation from an empty one.
Real example: the 9- and 21-period averages on Nvidia in 2026
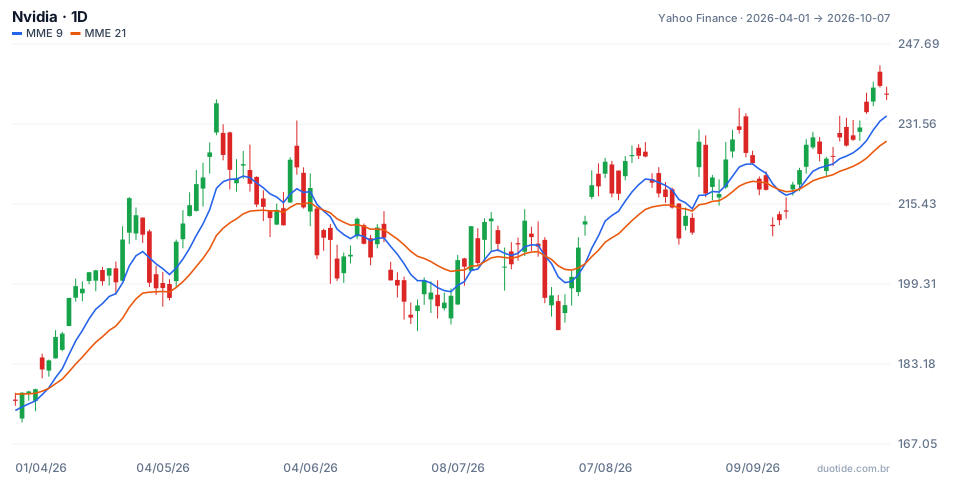
The chart shows Nvidia on the daily, from April 1 to October 7, 2026, with the 9- and 21-period exponential averages. The prices are daily, not intraday, but the logic of the averages, the ATR, and volume is the same on any time frame. Over the period the stock went from $175.75 to $237.47, up 35.12%, with a low of $171.37 on April 2 and a high of $243.37 on October 6.
When the crossover worked
On April 9, 2026, the 9-period average crossed above the 21-period one with the stock at $183.91. Ten sessions later, it was at $199.64, up 8.55%. The September 18 crossover, at $222.27, was also followed by a gain: $233.95 ten sessions later, or 5.25%.
When the crossover failed, and volume gave the warning
On July 14, the stock rose 4.06%, to $211.80, and the 9-period average crossed above the 21-period one. Volume, however, was 124.4 million shares, below the average of the previous 20 sessions (145.0 million). Ten sessions later, Nvidia was at $197.01, down 6.98%. In September, the averages crossed down on September 15 and crossed back up on September 18: two opposite signals in three sessions, typical of a directionless market.
High volume is no guarantee
On August 27, the stock rose 8.74%, to $227.98, with 298.9 million shares traded, 2.56 times the 20-session average. The next day it fell 4.57%, to $217.55. The volume confirmed there was real participation, but it didn't stop profit-taking right after.
Turning the ATR into position size
On October 7, Nvidia's 14-day ATR was $5.61, about 2.4% of the price. With a 1.5 ATR stop, the distance comes to 1.5 × 5.61 = $8.42 per share. Someone with a $10,000 account willing to risk 1% per trade ($100) can buy 100 ÷ 8.42 = 11.9, or 11 shares, a position of about $2,612. On the 5-minute chart, the ATR is much smaller, and the math is the same: the stop gets shorter and the quantity goes up, keeping the dollar risk the same.

How to use the indicators in day trading
Follow a fixed order
First the direction (averages), then the price's position relative to the VWAP, then the timing (oscillator), the stop last (ATR), and, if you want, volume as a filter. Always reading in the same order keeps a single indicator from deciding the trade on its own.
Use a larger time frame as context
The 9- and 21-period averages on the 5-minute chart work better when they're aligned with the trend on the 15-minute or 1-hour chart. Against the larger trend, the crossovers fail more often.
Limitations
All of these indicators look at past price. In a sideways market the averages cross constantly, as in September; on big news, the price jumps right past the stop. In day trading, costs (commissions, fees, and spread) weigh more because trades are frequent and targets are short.
Common mistakes with day-trading indicators
- Using the RSI and the stochastic together, as if their agreement were a confirmation.
- Trading every moving average crossover without checking the larger time frame's trend or the volume.
- Using a fixed stop in cents or points, with no relation to the current ATR.
- Buying far above the VWAP just because the price is rising sharply.
- Ignoring the costs of each trade, which add up over the day and can eat into the result.
- Concluding an indicator works based on two or three examples: the cases above describe what happened, not what will happen.
To practice without risking money, set up this group of indicators on a demo account, pick an asset and a fixed time window, and record every trade: the averages' direction, the price's position relative to the VWAP, the oscillator's reading, the stop's distance in ATR, and the result. After a few weeks, the log will show which filters actually help your trading style.
Practice before you risk. Open your Duotide account and test your ideas on the demo account with US$10,000 in virtual funds.
Create free accountUpdated:
Editorial character of the Duotide newsroom. Articles are written by the team with the help of artificial intelligence; prices and charts come from real market data. Explains charts, indicators and trading strategies: how they work, where they fail and how to test them first.
Was this article helpful?
Be the first to rate it.
Comments
- No comments yet. Be the first to comment.
Ready to put it into practice?
Open your account and practice on the demo account with US$10,000 in virtual funds, without risking money.
- Secure platformProtected login and identity verification
- Multilingual supportHelp available every day
- Free demo accountUS$10,000 virtual to practice
Trading involves the risk of losing the capital invested.
