

 Português pt
 Español es
 العربية ar
 বাংলা bn
 Deutsch de
 Filipino fil
 Français fr
 हिन्दी hi
 Bahasa Indonesia id
 Italiano it
 Русский ru
 Svenska sv
 ไทย th
 Türkçe tr
 Tiếng Việt vi
 简体中文 zh
Updated:
StrategiesHow to Choose the Time Frame (Expiration) of a Trade
 Naomi TanakaEditorial character · Analysis Desk

Quick answer
Choose a trade's time frame based on the reason for the entry and the asset's volatility: a signal on the daily chart calls for days, a signal on a minute chart calls for minutes or hours. Before entering, check whether the target fits how much the asset typically moves over that time frame. A time frame too short for the target turns a correct analysis into a losing trade.
Every trade has a time frame, even when it isn't written down: the time the idea needs to confirm. In some products the time frame is fixed and set at entry, like contracts with an expiration; in others, you decide it yourself. In both cases, the most common mistake is the same: picking a time frame that doesn't match the reason for the entry or how much the asset typically moves within that time.
In this guide, we use bitcoin's real daily quotes (BTC/USDT on Binance) between April and October 2026 to measure how much the price moved over 1, 5, and 20 days, and how those numbers help you choose a trade's time frame.
What a trade's time frame is
It's the time between the entry and the planned exit. It needs to be consistent with three things:
- The reason for the entry: a signal on the 5-minute chart resolves in minutes or hours; a breakout on the daily chart can take days or weeks.
- The target: a large target needs time to be reached.
- Volatility: the same target can be fast in a busy period and slow in a calm one.
A practical rule: the time frame should span a few candles of the timeframe where the signal appeared. A daily signal calls for a time frame of days; a signal on the 15-minute chart calls for a time frame of hours.

How to calculate a consistent time frame
The most direct way is to measure how much the asset typically moves over each horizon. For each day in the period, you calculate the absolute change between that day's close and the close 1, 5, or 20 days earlier, and take the average. On bitcoin, between April 1 and October 7, 2026:
- 1 day: average move of 1.4% (median of 0.99%). Only 8 of 189 days, 4.23%, moved 5% or more.
- 5 days: average move of 3.45% (median of 2.29%). In 18.92% of windows, the price moved 5% or more.
- 20 days: average move of 8.43% (median of 6.49%). In 57.06% of windows, the price moved 5% or more.
Notice the move doesn't grow in the same proportion as time. In markets that swing randomly, it tends to grow with the square root of the time frame: 1.4% × √5 ≈ 3.13% and 1.4% × √20 ≈ 6.26%. The measured values came out a bit higher than that, because there were trends during the period, but the idea holds: quadrupling the time frame doesn't quadruple the expected move.
The practical takeaway is that a 5% target in one day, on bitcoin, would require a day that happened only about 4% of the time over this period. The same target over 20 days was reached as a net move in more than half the windows, up or down.
Real example: bitcoin's volatility changes the time frame you need
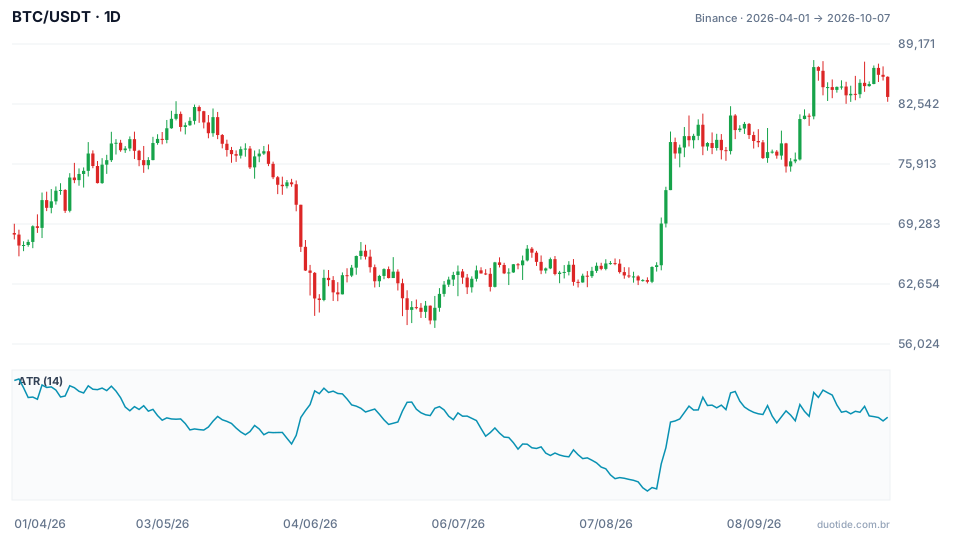
The bottom panel shows the 14-day ATR, which measures the average daily range. Between April 1 and October 7, 2026, BTC went from US$ 68,113.92 to US$ 83,321.81 (up 22.33%), with a low of US$ 57,800.19 on July 1 and a high of US$ 87,395.67 on September 21.
April: wide days
On April 2, the ATR stood at US$ 2,685.82, about 4% of the price (US$ 66,901.99), the period's highest value. In April, the average absolute daily move was 1.5%. A US$ 2,000 target fit within the move of one or two days.
July and August: narrow days
On August 16, the ATR fell to US$ 1,226.13, about 1.95% of the price (US$ 62,900), the period's lowest value. Between July 20 and August 16, the average absolute daily move was 0.84%, barely more than half of April's. The same US$ 2,000 target needed, on average, more time. Anyone who kept April's time frame during this period likely closed trades before the target was reached.
The turnaround after the calm
The week after the lowest ATR was the period's biggest rally: between August 17 and August 23, BTC rose from US$ 62,900 to US$ 77,734. The low volatility didn't last, and the ATR climbed again. On October 7, it stood at US$ 2,187.23, about 2.6% of the price. These numbers describe what happened, not what will happen.

How to use the time frame in practice
Set the time frame before entering
Write it into the plan: entry, stop, target, and maximum time frame. If the time frame passes without either the target or the stop being hit, the original idea didn't confirm, and exiting is a legitimate decision.
Check whether the target fits the time frame
Compare the target with the asset's average move over the chosen horizon. If the target is three times bigger than the typical move for that time frame, either the target is too big or the time frame is too short.
Revise with volatility
When the ATR drops by half, as it did between April and August, the same target needs more time. Adjust the time frame or the target, not both in the wrong direction.
Limitations
Average moves describe the past and hide extremes: on BTC, there were 5-day windows with a 24.54% move. News can compress weeks of movement into a single day. On products with a fixed expiration, getting the time frame wrong can mean losing the trade even while getting the direction right.
Common mistakes when choosing the time frame
- Using a daily chart signal for a trade lasting a few minutes, or the reverse.
- Choosing a target bigger than the asset typically moves within the chosen time frame.
- Keeping the same time frame when volatility drops or rises sharply.
- Extending the time frame after entry just to avoid taking a loss.
- Choosing time frames that are too short out of anxiety, when the reason for the entry called for days.
To practice without risking money, log on a demo account, for every trade, the signal's timeframe, the target, the planned time frame, and how long the trade actually took. After a few dozen entries, you'll have your own measure of the time frame that works for each type of entry.
Practice before you risk. Open your Duotide account and test your ideas on the demo account with US$10,000 in virtual funds.
Create free accountUpdated:
Editorial character of the Duotide newsroom. Articles are written by the team with the help of artificial intelligence; prices and charts come from real market data. Explains charts, indicators and trading strategies: how they work, where they fail and how to test them first.
Was this article helpful?
Be the first to rate it.
Comments
- No comments yet. Be the first to comment.
Ready to put it into practice?
Open your account and practice on the demo account with US$10,000 in virtual funds, without risking money.
- Secure platformProtected login and identity verification
- Multilingual supportHelp available every day
- Free demo accountUS$10,000 virtual to practice
Trading involves the risk of losing the capital invested.
