

 Português pt
 Español es
 العربية ar
 বাংলা bn
 Deutsch de
 Filipino fil
 Français fr
 हिन्दी hi
 Bahasa Indonesia id
 Italiano it
 Русский ru
 Svenska sv
 ไทย th
 Türkçe tr
 Tiếng Việt vi
 简体中文 zh
Updated:
StrategiesExponential Moving Average (EMA) Crossover in Trading
 Naomi TanakaEditorial character · Analysis Desk

Quick answer
The EMA crossover uses two exponential moving averages, a short one and a long one (for example, 9 and 21 periods): the short one crossing above the long one is a bullish signal, and below, a bearish one. Since the EMA gives more weight to recent prices, it turns faster than the simple average, but it's still lagging relative to the price. In a trend, the method captures a good part of the move; in a sideways market, it generates false signals back to back.
The exponential moving average crossover is one of the most commonly taught strategies for beginners in technical analysis, and for good reason: it's easy to see on the chart, easy to automate, and doesn't depend on interpreting patterns. The idea is to track two EMAs of different periods and act when one crosses the other.
In this guide we use real daily gold quotes (the futures contract on the New York exchange, in dollars per ounce) between April and October 2026, with the 9- and 21-session EMAs, to show the calculation and the signals that actually showed up.
What the EMA is
The EMA (exponential moving average) is an average where more recent prices weigh more than older ones. In the simple average, today's close and the one from 20 days ago carry the same weight; in the exponential one, the weight of older data decays gradually. That's why the EMA reacts faster to changes in direction, which matters for a strategy that depends on the timing of the crossover.
How the crossover works
- Bullish crossover: the short EMA crosses from below to above the long EMA. Recent prices are pulling the average up more strongly than the history.
- Bearish crossover: the short EMA crosses from above to below the long EMA, a sign of weakening.

How to calculate the EMA
The formula uses a weighting factor k = 2 ÷ (N + 1):
- 9-period EMA: k = 2 ÷ 10 = 0.2. 21-period EMA: k = 2 ÷ 22 = 0.0909.
- Today's EMA = close × k + yesterday's EMA × (1 − k).
Example with real gold data
On August 4, 2026, the 9-period EMA was at US$4,093.06 and the 21-period one at US$4,098.44, with the short one still below the long one. On August 5 gold closed at US$4,305.20:
- 9-period EMA = 4,305.20 × 0.2 + 4,093.06 × 0.8 = 861.04 + 3,274.45 = 4,135.49
- 21-period EMA = 4,305.20 × 0.0909 + 4,098.44 × 0.9091 ≈ 391.38 + 3,725.85 = 4,117.2
- The 9-period EMA went from US$5.38 below to US$18.26 above the 21-period one: a bullish crossover.
Notice that a single strong day was enough to flip the order of the averages. That's what makes the EMA fast, and also what makes it react to isolated days.
Real example: the 9- and 21-period EMAs on gold
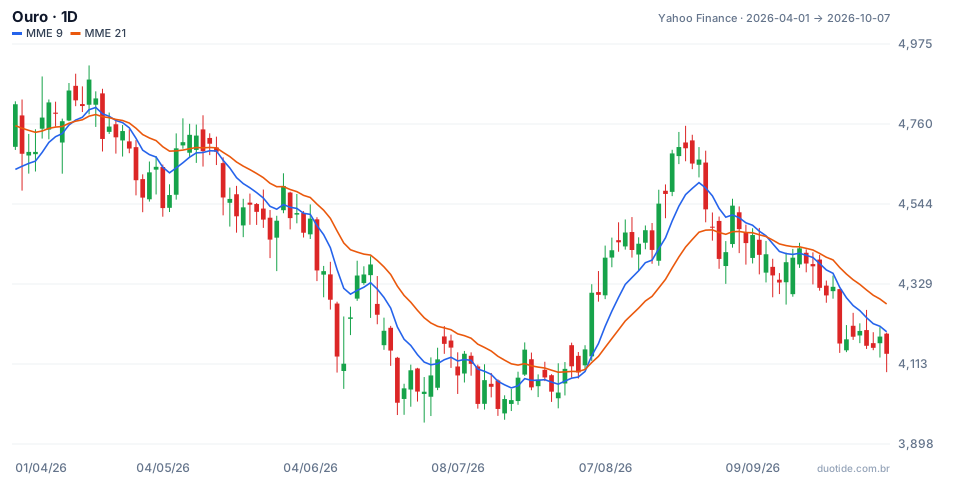
Over the chart's period, gold fell from US$4,813.10 (April 1) to US$4,140.70 (October 7), down 13.97%, with a high of US$4,917.70 on April 17 and a low of US$3,955.40 on June 30. There were four crossovers. Imagine someone who buys on the bullish crossover and sells on the bearish one.
April: a bullish signal near the top
The bullish crossover on April 15 came out with gold at US$4,823.60. Two sessions later came the period's high, US$4,917.70, and on April 23 the bearish crossover signaled an exit at US$4,724.00: −US$99.60 per ounce, or −2.06%. The signal arrived when the rally was already ending.
April to August: the value of staying out
Between April 23 and August 5, the 9-period EMA stayed below the 21-period one. During that stretch gold went from US$4,724.00 to a low of US$3,955.40 on June 30, down 16.27%. For anyone who only trades long, the bearish crossover worked as a filter to avoid buying during the decline.
August to September: got the direction right, gave back the profit
On the August 5 buy at US$4,305.20, gold reached US$4,755.00 on August 25, US$449.80 above the entry. The bearish crossover only came on September 14, at US$4,351.90: a profit of US$46.70 per ounce, or 1.08%, about a tenth of what the move had offered at its peak. After the exit, gold closed October 7 at US$4,140.70, 4.85% lower.
For comparison: with simple 9- and 21-period averages over the same period there were six crossovers, including a bullish one on May 18 and a bearish one the very next day. The EMA doesn't always generate more signals; it depends on the price's path. The cases above describe what happened, not what will happen.

How to use the EMA crossover
As a trend filter
The most robust use is deciding the side: with the short EMA above, only buys; below it, only sells or nothing. The April-to-August case shows the value of this.
With an exit faster than the opposite crossover
In August, waiting for the bearish crossover gave back almost all the gain. Common alternatives are a trailing stop of a few times the ATR, or exiting on a close below the short EMA.
With a filter against sideways markets
A long average, like the 200-period one, or an ADX above 20 to 25, help avoid trading when the two EMAs are tangled together.
Limitations
The EMA is calculated from past prices, so every crossover arrives after part of the move has already happened. In a sideways market, the averages cross back and forth and every signal ends in a small loss, the effect known as whipsaw. And since a single strong day can flip the short EMA, isolated news events generate signals that don't hold up.
Common mistakes with the EMA crossover
- Trading every crossover, with no trend or sideways-market filter.
- Using the opposite crossover as the only exit and giving back the profit from short trends.
- Choosing the periods by looking backward until finding the combination that would have made the most profit.
- Confusing the EMA with the simple average: the values and the crossover dates are different.
- Entering without a stop, counting on the next crossover to signal when to exit.
To practice, put the 9- and 21-period EMAs on the daily chart of an asset on a demo account and log every crossover, the entry price, the best price reached, and the price of the next crossover. The gap between what the move offered and what the rule delivered will show where your exit needs to improve.
Practice before you risk. Open your Duotide account and test your ideas on the demo account with US$10,000 in virtual funds.
Create free accountUpdated:
Editorial character of the Duotide newsroom. Articles are written by the team with the help of artificial intelligence; prices and charts come from real market data. Explains charts, indicators and trading strategies: how they work, where they fail and how to test them first.
Was this article helpful?
Be the first to rate it.
Comments
- No comments yet. Be the first to comment.
Ready to put it into practice?
Open your account and practice on the demo account with US$10,000 in virtual funds, without risking money.
- Secure platformProtected login and identity verification
- Multilingual supportHelp available every day
- Free demo accountUS$10,000 virtual to practice
Trading involves the risk of losing the capital invested.
