

 Português pt
 Español es
 العربية ar
 বাংলা bn
 Deutsch de
 Filipino fil
 Français fr
 हिन्दी hi
 Bahasa Indonesia id
 Italiano it
 Русский ru
 Svenska sv
 ไทย th
 Türkçe tr
 Tiếng Việt vi
 简体中文 zh
Updated:
StrategiesDual Stochastic Strategy: How to Combine Two Oscillators
 Naomi TanakaEditorial character · Analysis Desk

Quick answer
Dual stochastic uses two stochastic oscillators at the same time: a slow one (for example, 21 periods) to set the side of the trade, and a fast one (for example, 5 periods) to pick the entry moment. A buy is only considered when the slow one exits oversold and the fast one crosses up. The filter reduces the number of signals, but doesn't eliminate false ones.
A single stochastic, especially with a short period, generates too many signals: it crosses up and down several times a week, many of them with no real consequence. The dual stochastic strategy tries to filter that noise by combining two oscillators running at different speeds, a slow one to say which side to trade in favor of, and a fast one to pick the entry moment.
In this guide we use real daily quotes for Apple (AAPL) between April and October 2026 to show the calculation of the two oscillators and what the combined signals actually showed, including one that went wrong.
What dual stochastic is
The stochastic oscillator, created by George Lane, shows where today's close sits within the range between the high and the low of the last N periods, on a scale from 0 to 100. Near 100, price closed near the top of the recent range; near 0, near the bottom. Above 80 is called overbought, below 20 oversold.
In dual stochastic, two are used at once. A common setup is the slow stochastic at 21 periods, which reflects momentum over a few weeks, and the fast one at 5 periods, which reacts every few sessions. Both have a %K line and a %D line, which is the 3-period average of %K.

How to calculate the stochastic
- %K = 100 × (close − lowest low of N) ÷ (highest high of N − lowest low of N)
- %D = simple average of the last 3 %K values
Example with real Apple data on June 26, 2026
That day the stock closed at $283.78.
- Fast (5 periods): from June 22 to June 26, the highest high was $302.42 (June 22) and the lowest low was $273.75 (June 25). %K = 100 × (283.78 − 273.75) ÷ (302.42 − 273.75) = 100 × 10.03 ÷ 28.67 = 35.0
- Slow (21 periods): from May 28 to June 26, the highest high was $317.40 (June 8) and the lowest low was the same as June 25. %K = 100 × 10.03 ÷ 43.65 = 23.0
The same close shows up at different points on the two scales because the 21-day range is much wider. That difference in perspective is exactly what the strategy takes advantage of.
Real example: Apple's signals in 2026
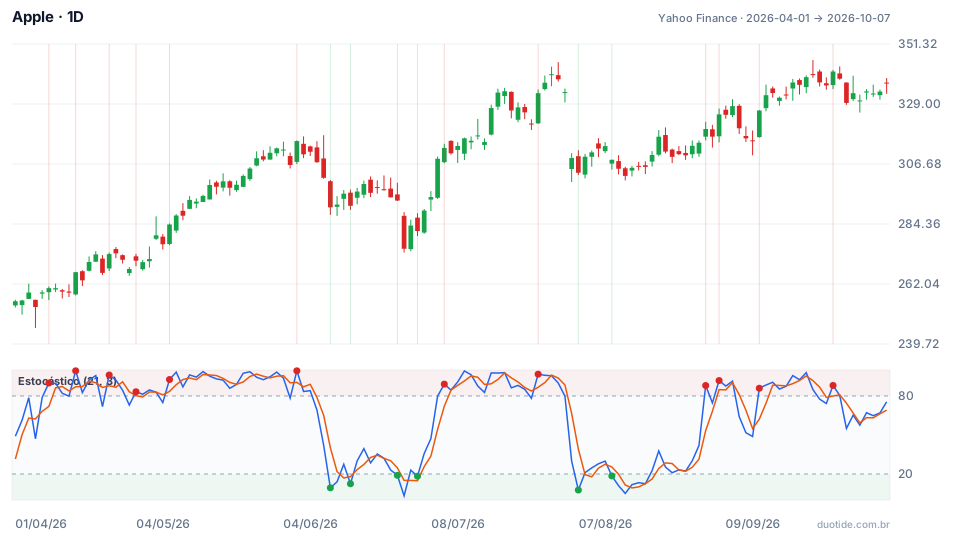
The chart shows Apple from April 1, 2026 ($255.63) to October 7, 2026 ($336.67), with the slow stochastic (21, 3) in the panel below. The rule tested here is: buy when the slow one exits the zone below 20 and the fast one has %K above %D after passing through oversold territory. Three moments show what it does.
June 15: the signal that failed
The slow one rose from 12.5 to 30.1 and the fast one crossed up (%K 67.6 against %D 35.9) coming from 12.5. The stock closed at $296.42. On June 25 it fell to $275.15, 7.2% lower, with a low of $273.75, and ten sessions after the signal it was at $289.36 (−2.4%). Two oscillators agreeing didn't stop the drop.
June 26: the signal that worked
One day after the bottom, the slow one came back from 3.2 to 23.0 and the fast one from 4.9 to 35.0, above a %D of 13.8. Close of $283.78. Ten sessions later, on July 13, the stock was at $317.31, up 11.8%.
August 4: the signal that went sideways
After the drop on July 31, the slow one went from 7.7 to 21.0 and the fast one crossed up, also at 21.0, above a %D of 16.2. Close of $309.38. Over the next ten sessions the stock reached a low of $300.57 (−2.8%) and ended on August 18 at $310.03, essentially flat. Only after that did the rally come.

How to use dual stochastic
The slow one sets the side
If the slow one is rising and exiting oversold, only buys are considered. If it's falling and exiting overbought, only sells. When the slow one sits in the middle of the scale with no clear direction, the strategy stays out.
The fast one sets the timing
Within the chosen side, the trigger is the fast %K crossing over %D, preferably coming from an extreme zone. A fast signal against the slow one is ignored.
Stop and target from the chart
The oscillators don't tell you where to place the stop. A common reference is just below the recent low, which on June 26 was $273.75, with the target at the next resistance. Size the position from that distance.
Two timeframes instead of two periods
The same idea can be applied with a single stochastic on two charts: the 4-hour chart for context and the 15-minute chart for entry, for example.
Limitations
Both oscillators come from the same price, so agreeing with each other isn't an independent confirmation. In a strong trend, the stochastic stays pinned at one end for days, as happened from July 6 to July 17, when the slow one stayed above 80 while the stock kept rising. And, as the June 15 example shows, the filter reduces signals but doesn't eliminate false ones.
Common mistakes with dual stochastic
- Trading every fast crossover, even against the slow one's direction.
- Treating oversold as a buy signal on its own, without waiting for the slow one to turn.
- Using the two oscillators without looking at support, resistance, and the larger-timeframe trend.
- Changing the periods after every losing trade, chasing the perfect setup.
- Forgetting that the examples above describe what happened to Apple, not what will happen.
To practice without risking money, set up both stochastics on a demo account chart and log, over a few weeks, every combined signal: date, price, stop, and what price did ten sessions later. That record tells you more about the strategy on your asset than any ready-made rule.
Practice before you risk. Open your Duotide account and test your ideas on the demo account with US$10,000 in virtual funds.
Create free accountUpdated:
Editorial character of the Duotide newsroom. Articles are written by the team with the help of artificial intelligence; prices and charts come from real market data. Explains charts, indicators and trading strategies: how they work, where they fail and how to test them first.
Was this article helpful?
Be the first to rate it.
Comments
- No comments yet. Be the first to comment.
Ready to put it into practice?
Open your account and practice on the demo account with US$10,000 in virtual funds, without risking money.
- Secure platformProtected login and identity verification
- Multilingual supportHelp available every day
- Free demo accountUS$10,000 virtual to practice
Trading involves the risk of losing the capital invested.
