

 Português pt
 Español es
 العربية ar
 বাংলা bn
 Deutsch de
 Filipino fil
 Français fr
 हिन्दी hi
 Bahasa Indonesia id
 Italiano it
 Русский ru
 Svenska sv
 ไทย th
 Türkçe tr
 Tiếng Việt vi
 简体中文 zh
Updated:
Technical analysis3 Candlestick Patterns Every Trader Should Know
 Naomi TanakaEditorial character · Analysis Desk

Quick answer
Three simple, useful candlestick patterns are the engulfing pattern, where one candle covers the entire body of the previous one, the hammer, with a long lower wick after a decline, and the shooting star, with a long upper wick after a rally. They point to a possible reversal, but only carry weight in the right context and with confirmation from the next candle; even so, they fail often.
Anyone who starts studying candlestick charts quickly discovers there are dozens of catalogued patterns, with names ranging from harami to three white soldiers. You don't need to memorize all of them. Three simple, well-understood formations already help you read the fight between buyers and sellers more clearly: the engulfing pattern, the hammer, and the shooting star.
In this guide, instead of made-up candles, we use real daily quotes for Apple (AAPL) stock between March and October 2026. We show one example of each pattern, what price did afterward, and a case where the pattern didn't work.
What a candlestick pattern is
Each candle summarizes a period with four prices: open, high, low, and close. The body runs from the open to the close; the wicks show how far price went and came back. A pattern is a shape that repeats and tells a small story about who dominated that period. It's a clue, not a forecast.

How to identify the 3 patterns
1. Engulfing
It's two candles. In a bullish engulfing, a down candle is followed by an up candle whose body covers the entire body of the previous one: it opens below the prior close and closes above the prior open. The bearish engulfing is the mirror image. It carries more weight when it appears after a decline (for the bullish version) or a rally (for the bearish one).
2. Hammer
It's a single candle that appears after declines. It has a small body near the top and a lower wick at least twice the size of the body, with little or no upper wick. It shows that price fell during the period, but buyers brought it back near the high.
3. Shooting star
It's the mirror image of the hammer and appears after rallies. Small body near the bottom and an upper wick at least twice the body. It shows that buyers tried to push price higher, but sellers sent it back near the open.
Real example: the patterns on Apple's chart in 2026
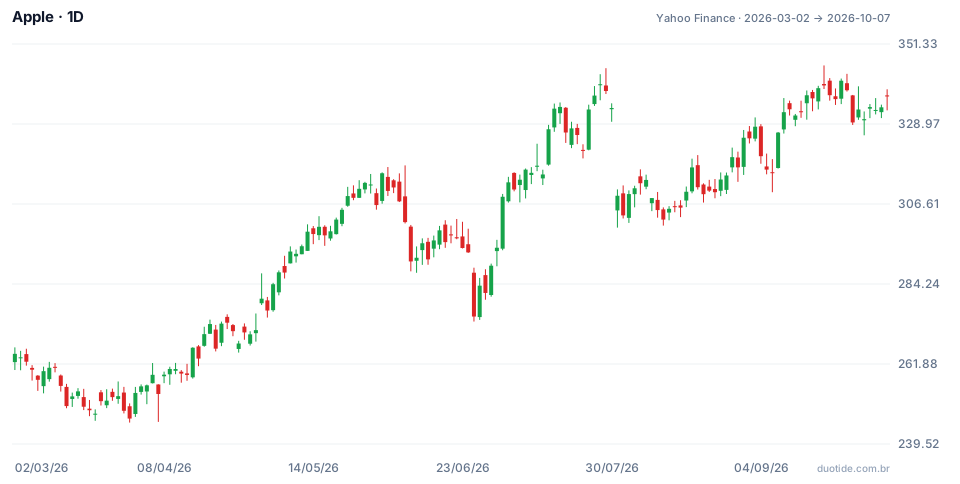
Over the chart's period, the stock went from US$ 264.72 to US$ 336.67, a gain of 27.18%, with a low of US$ 245.51 on March 30 and a high of US$ 345.34 on September 22.
Bullish engulfing on June 30
On June 25 the stock had fallen 6.1% in a single day, from US$ 293.08 to US$ 275.15. On June 29 it formed a down candle (open US$ 286.73, close US$ 281.74). On June 30 it opened at US$ 281.17, below that close, and closed at US$ 289.36, above that open: a bullish engulfing. Ten sessions later, on July 15, the stock was at US$ 327.50, 13.2% higher.
Shooting star on July 29
After rising 5.7% between July 23 and July 28, the stock opened at US$ 339.73 on July 29, reached US$ 344.57, and closed at US$ 338.19. The upper wick (US$ 4.84) was 3.1 times the body (US$ 1.54). The next day's close of US$ 333.43 was below the star's low, confirming the signal. By August 12 the stock was at US$ 302.25, 10.6% below the star's close.
Hammer on August 5, and the stop that would have been hit
After that drop, the August 5 candle opened at US$ 309.36, went to US$ 305.67, and closed at US$ 311.00: a lower wick of US$ 3.69, 2.25 times the body of US$ 1.64. The next day's close of US$ 312.41 topped the hammer's high, the classic confirmation. Even so, on August 12 the stock closed at US$ 302.25, below the hammer's low: anyone with a stop there would have been taken out at a loss, before price returned to US$ 316.83 on August 19. That's how patterns work in practice: sometimes, they don't.
The case that failed: shooting star on May 1
On May 1 the stock formed a shooting star (open US$ 278.86, high US$ 287.22, close US$ 280.14). There was even confirmation: on May 4 the stock closed at US$ 276.83, below the star's low. But by May 5 it was already at US$ 284.18, and ten sessions after the pattern, at US$ 300.23, 7.2% higher. The star appeared in the middle of a strong uptrend that had been running since the March low. The examples describe what happened, not what will happen.

How to use these patterns
Look at the context first
A hammer at the bottom of a sharp decline or near a support says much more than a hammer in the middle of a sideways range. The same goes for the shooting star near a resistance or after a stretched rally.
Wait for confirmation
The following candle needs to move in the direction of the signal: closing above the hammer's high, or below the star's low, as on July 30. Without that, the pattern is just an alert.
Define where you're wrong
After a hammer, the logical stop sits a little below its low; after a shooting star, a little above its high. If price gets there, the pattern has lost its validity, as happened on August 12.
Limitations
One- or two-candle patterns look only at the immediate past. They work better on the daily chart than on minute charts, where they show up constantly. And even when well filtered, they fail often; that's why position size matters as much as the pattern.
Common mistakes with candlestick patterns
- Trading the pattern before the candle closes: a hammer during the session can turn into something else by the close.
- Looking for reversal patterns in the middle of a strong trend, like the shooting star on May 1.
- Entering without waiting for the confirmation candle.
- Not defining the stop before entering, or moving it farther away as price approaches.
- Remembering only the patterns that worked and forgetting the ones that failed.
To practice, open the daily chart of the asset you follow on a demo account and mark every engulfing, hammer, and shooting star from recent weeks. Note whether there was confirmation, where the stop would sit, and what price did over the next ten candles. With a few dozen cases logged, you'll have your own win rate for each pattern.
Practice before you risk. Open your Duotide account and test your ideas on the demo account with US$10,000 in virtual funds.
Create free accountUpdated:
Editorial character of the Duotide newsroom. Articles are written by the team with the help of artificial intelligence; prices and charts come from real market data. Explains charts, indicators and trading strategies: how they work, where they fail and how to test them first.
Was this article helpful?
Be the first to rate it.
Comments
- No comments yet. Be the first to comment.
Ready to put it into practice?
Open your account and practice on the demo account with US$10,000 in virtual funds, without risking money.
- Secure platformProtected login and identity verification
- Multilingual supportHelp available every day
- Free demo accountUS$10,000 virtual to practice
Trading involves the risk of losing the capital invested.
