

 Português pt
 Español es
 العربية ar
 বাংলা bn
 Deutsch de
 Filipino fil
 Français fr
 हिन्दी hi
 Bahasa Indonesia id
 Italiano it
 Русский ru
 Svenska sv
 ไทย th
 Türkçe tr
 Tiếng Việt vi
 简体中文 zh
Updated:
Strategies3 Strategies for Short-Term Trades: Breakout, Reversal, News
 Naomi TanakaEditorial character · Analysis Desk
Quick answer
Three common short-term strategies are breakout with volume, reversal at support or resistance with candle confirmation, and reaction to economic calendar news. All of them wait for market confirmation before entering and define the stop before the trade. Using the ATR to size the stop helps keep the same money risk as volatility changes.
Short-term trades demand a specific kind of discipline: the decision is fast, and there's almost no time to think it over again after the entry. That doesn't mean trading on impulse. It means the opposite: the strategy, the stop, and the position size need to be defined before the trade begins.
Below are three approaches that respond to different market scenarios. To put concrete numbers to the risk of each one, we used the real ATR (average true range) of EUR/USD, the most traded currency pair in the world, between March and October 2026.
What short-term strategies are
These are strategies in which the trade lasts from minutes to a few days. The profit on each one tends to be small, so the cost of every mistake weighs more. That's why all three below have something in common: they wait for confirmation from the market before entering and define where to exit if they're wrong.

The 3 strategies
1. Breakout with volume confirmation
Looks for the start of a strong move right after price breaks a support or resistance that had been respected over several candles. The main filter is volume: a breakout with volume well above the recent average has more participants behind it. In practice, you wait for the candle that breaks the level to close beyond it, rather than entering as soon as price merely touches it. The logical stop sits on the other side of the broken level: if price moves back inside the old range, the reading no longer holds.
2. Reversal at support or resistance with candle confirmation
Bets on price's reaction when it reaches a level that's already been tested. The confirmation is a rejection candle, such as a long wick against the level, followed by a close in the expected direction. Works best in a sideways market. The classic mistake is using it exactly when price is breaking out of the range to start a new trend.
3. Reaction to economic calendar news
Interest rate decisions and employment data tend to generate volatility spikes within minutes. The approach isn't to guess the number, but to wait for the first reaction to form and trade its continuation or its correction, with smaller-than-normal risk, because the range at these moments strays from the usual pattern.
How to calculate the stop and position size with the ATR
The 14-period ATR measures how much price moves, on average, per candle. Using it for the stop avoids two mistakes: a stop too tight in a volatile market and a stop too wide in a calm one. The math has three steps:
- Risk in money: account size × risk percentage. With US$ 4,000 and 1% per trade, the risk is US$ 40.
- Stop distance: a multiple of the ATR. Here, 1 ATR.
- Size: risk in money ÷ (stop distance × value of each pip). On EUR/USD, each pip is worth US$ 0.10 on a micro lot of 1,000 euros.
With EUR/USD's daily ATR from October 6, 2026, of 0.00654 (about 65 pips), the math works out to: US$ 40 ÷ (65.4 pips × US$ 0.10) = 6.1, or 6 micro lots. Rounding is always down, to avoid exceeding the defined risk.

Real example: EUR/USD's volatility in 2026
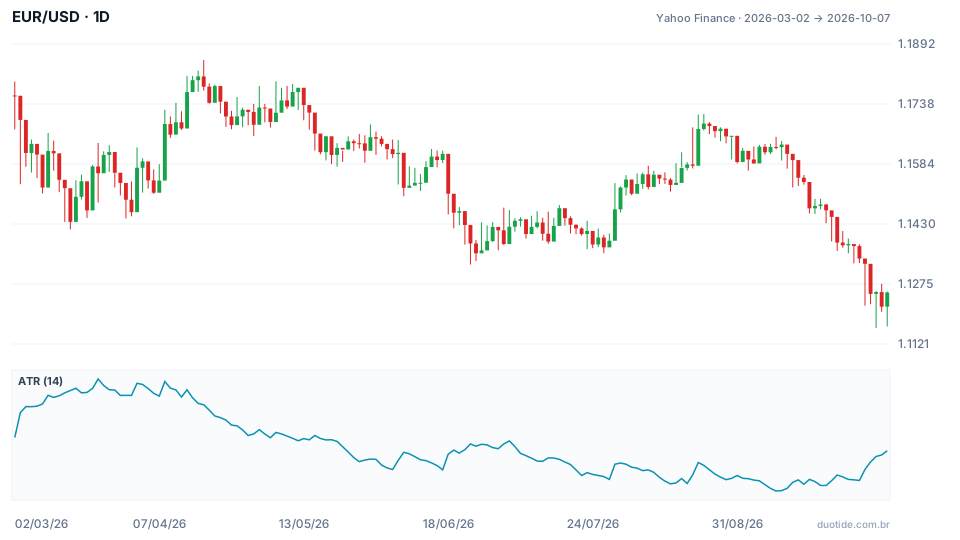
The chart shows EUR/USD from March 2, 2026 to October 6, 2026 with the 14-day ATR in the panel below. Over the period, the pair fell 4.3%, from about 1.18 to 1.13. What stands out most is how much the daily range changed.
March: ATR at the period's highest level
On March 23 the ATR reached 0.00977, about 98 pips, the highest value in the series. With the same US$ 4,000 account and the same US$ 40 risk, the position would drop to 4 micro lots (40 ÷ 9.77 = 4.1). Using a calm month's size there would mean risking double what was planned.
September: the calmer market
On September 8 the ATR stood at 0.00473, about 47 pips, the lowest in the period. The same account would allow 8 micro lots (40 ÷ 4.73 = 8.5, rounded down). The risk in money is the same in all three cases; what changes is the size.
The widest-range day
On March 3 the difference between EUR/USD's high and low was about 175 pips (from 1.1707 to 1.1532), 2.1 times that day's ATR of 0.00825. That's the kind of day on which a 1-ATR stop gets hit easily, and on which the news strategy calls for a smaller position. The numbers describe what happened in the period, not what will happen next.
How to use each strategy
Breakout
Use it when price has spent several candles compressed near a level. Enter only on the close beyond it, with the stop on the other side of the level or at 1 ATR, whichever is farther, and recalculate the size.
Reversal
Use it in a clear sideways range. The stop sits beyond the wick of the rejection candle. If the ATR is rising fast, that's a sign the range may be about to break; reduce exposure or stay out.
News
Use it only with the economic calendar open, and wait for the first reaction to finish. Reduce the size, because the range can exceed twice the ATR, as on March 3.
Limitations
The ATR measures range, not direction: a high ATR doesn't say whether price will go up or down. It's also calculated from past data, so it reacts with a lag to a sudden change. And none of the three strategies eliminates losing streaks.
Common mistakes in short-term trades
- Entering the breakout before the candle closes and getting caught by a false breakout.
- Using a reversal strategy when the market is leaving the range to form a trend.
- Keeping the same position size when the ATR doubles.
- Trading the news before the data comes out, betting on direction.
- Deciding position size in the heat of the moment, instead of before the entry.
- Ignoring costs: in fast trades, spread and brokerage fees eat up a larger share of the gain.
To practice, pick one of the three strategies and apply it in a demo account for a few weeks, always calculating position size with the day's ATR. Log the date, the ATR, the stop, the size, and the result of each trade. That record shows whether the strategy works for you and whether your risk actually stayed within the limit.
Practice before you risk. Open your Duotide account and test your ideas on the demo account with US$10,000 in virtual funds.
Create free accountUpdated:
Editorial character of the Duotide newsroom. Articles are written by the team with the help of artificial intelligence; prices and charts come from real market data. Explains charts, indicators and trading strategies: how they work, where they fail and how to test them first.
Was this article helpful?
Be the first to rate it.
Comments
- No comments yet. Be the first to comment.
Ready to put it into practice?
Open your account and practice on the demo account with US$10,000 in virtual funds, without risking money.
- Secure platformProtected login and identity verification
- Multilingual supportHelp available every day
- Free demo accountUS$10,000 virtual to practice
Trading involves the risk of losing the capital invested.
