

 Português pt
 Español es
 العربية ar
 বাংলা bn
 Deutsch de
 Filipino fil
 Français fr
 हिन्दी hi
 Bahasa Indonesia id
 Italiano it
 Русский ru
 Svenska sv
 ไทย th
 Türkçe tr
 Tiếng Việt vi
 简体中文 zh
Updated:
Strategies5 day trading strategies for beginners, with real examples
 Naomi TanakaEditorial character · Analysis Desk

Quick answer
For beginners, the five most used day trading strategies are range breakout, exhaustion reversal, moving average pullback, scalping, and news trading. Breakout and pullback are the easiest to turn into clear rules. None of them works without a stop defined before the entry and without controlling the cost of every trade.
Day trading means opening and closing a trade within the same session, without carrying a position overnight. That removes the risk of the price opening very differently the next day, but it charges a different price: quick decisions, costs that add up, and the temptation to trade on impulse. Without a written strategy, day trading turns into a sequence of clicks.
To show each strategy with real numbers, we used Nvidia's real daily quotes (NVDA, Yahoo Finance) between April and October 2026, along with the 9- and 21-period exponential moving averages. The daily chart doesn't show the minute-by-minute action of each session, but it shows the context a day trader needs to know before opening the platform: trend, daily range, and gaps.
What a day trading strategy is
It's a set of rules that answers four questions before the entry: in what situation do I trade, where do I enter, where do I exit if I'm wrong (stop), and where do I exit if I'm right (target). If any of these answers gets decided in the moment, it's not a strategy, it's a guess.
The day's range as a starting point
Between April 1 and October 7, 2026, the average distance between NVDA's daily high and low was 2.88% of the opening price. With the stock at US$ 237.47, as at the October 7 close, that's about US$ 6.84 a day. A US$ 10 target in a single session requires a day well above average; a US$ 0.50 stop will likely get hit by the normal back-and-forth. This number helps calibrate the target and stop for any of the strategies below.

Real example: Nvidia with 9- and 21-period moving averages
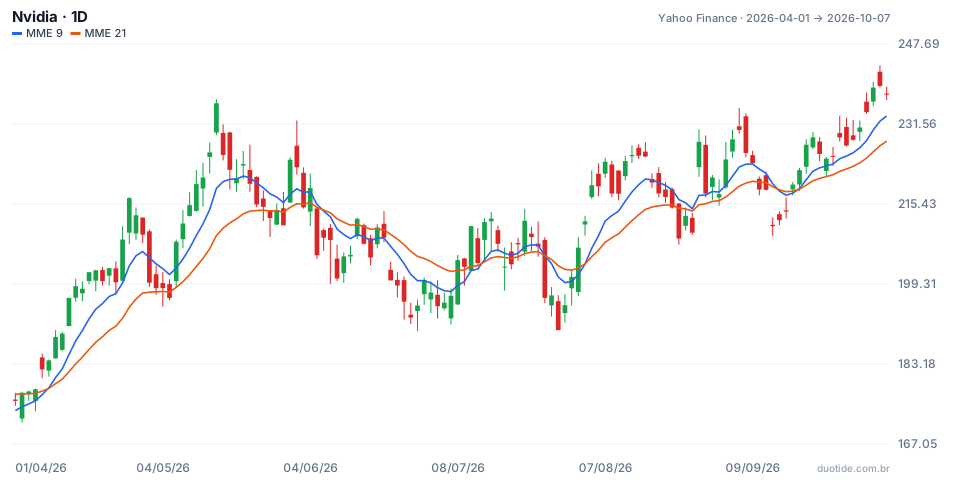
Over the period, NVDA went from US$ 175.75 (April 1) to US$ 237.47 (October 7), a gain of 35.1%, but with two corrections along the way. The cases below use this chart to illustrate each strategy. They describe what happened, not what will happen.
The 5 day trading strategies
1. Breakout
The price stays stuck for a while between a support and a resistance; when it breaks through one side on above-normal volume, the trader enters in the direction of the breakout. The stop goes on the other side of the broken level. On August 27, 2026, NVDA opened at US$ 222.86, 6.3% above the previous close (US$ 209.66), and reached US$ 230.47 during the day, another 3.4% from the open. Days like this favor the breakout, but not every breakout continues: many fall back inside the range minutes later.
2. Exhaustion reversal
After a strong run, the price strays too far from the moving averages and tends to pull back. The trader looks for a rejection candle to trade against the move, with a short stop. On May 14, 2026, NVDA closed at US$ 235.74, 7.8% above the 9-period average (US$ 218.59). The next day it closed at US$ 225.32, a 4.4% drop. It's the riskiest of the five strategies, because it goes against the flow: in a strong trend, the price can stay stretched for days.
3. Moving average pullback
In an uptrend, the price periodically comes back near a moving average and then resumes climbing. The trader waits for the pullback instead of buying at the top, and places the stop below the average. On May 28, 2026, NVDA closed at US$ 214.25, sitting right on the 21-period average (US$ 214.06). On June 1 it closed at US$ 224.36, 4.7% higher. The same reasoning failed a few days later: on June 5 the price closed at US$ 205.10, below the 21-period average (US$ 214.75), and the correction took the stock down to a close of US$ 190.01 on July 29. When the price closes on the other side of the average, the pullback setup is invalidated.
4. Scalping
This involves many short trades, from seconds to a few minutes, chasing a few cents per share. The critical point is cost: if every round trip costs US$ 0.02 per share between spread and fees (a hypothetical figure, for the calculation), a US$ 0.10 target loses 20% of the gross gain to cost, and a US$ 0.10 loss becomes US$ 0.12. With dozens of trades a day, this detail decides the result. It requires highly liquid assets, fast execution, and full attention.
5. News trading
Earnings releases, inflation data, and interest rate decisions move the price within minutes. The trader waits for the first move to pass and trades the breakout or the rejection of the high and low of the first few minutes. The risk is that the spread widens and the price jumps past the stop. August 27 shows the other side: the following session, August 28, NVDA opened at US$ 227.36, fell to US$ 216.81, and closed at US$ 217.55. Anyone who held a position overnight from the August 27 close (US$ 227.98) lost 4.6% from one day to the next; anyone who day traded and closed out on the 27th wasn't exposed to that.

How to use these strategies
Pick one and master it
The five require different skills. Breakout and pullback are the simplest to write as clear rules, and that's why they tend to be the best for beginners. Reversal and news trading demand more experience.
Use the daily chart as a filter
Trade in the direction of the daily trend. If the 9-period average is above the 21-period one and the price is above both, favor long trades; in the opposite setup, favor short trades or stay out.
Set the risk beforehand
Risk a small, fixed fraction of capital per trade, and have a daily loss limit. Once you hit the limit, the day is over.
Limitations
No strategy wins every time. Brokerage costs, spread, and slippage (the difference between the requested price and the executed one) eat into part of the result, especially in scalping. And an asset's past results don't necessarily repeat in another asset, or even in the same asset in a different period.
Common mistakes in day trading
- Trading without a stop or moving the stop away when the price reaches it.
- Trying all five strategies in the same week without mastering any of them.
- Ignoring the average daily range and setting targets the asset rarely reaches.
- Carrying a trade overnight that was meant to be a day trade because it's at a loss.
- Forgetting costs: many small trades can show a gross profit and a net loss.
- Trading against the daily chart's trend without a clear reason.
Before using real money, pick one strategy, write down the entry, stop, and target rules, and apply it on a demo account for a few weeks. Log every trade with date, asset, reason, and result. If after dozens of trades the log doesn't show an edge, adjust the rule on the demo account, not the real one.
Practice before you risk. Open your Duotide account and test your ideas on the demo account with US$10,000 in virtual funds.
Create free accountUpdated:
Editorial character of the Duotide newsroom. Articles are written by the team with the help of artificial intelligence; prices and charts come from real market data. Explains charts, indicators and trading strategies: how they work, where they fail and how to test them first.
Was this article helpful?
Be the first to rate it.
Comments
- No comments yet. Be the first to comment.
Ready to put it into practice?
Open your account and practice on the demo account with US$10,000 in virtual funds, without risking money.
- Secure platformProtected login and identity verification
- Multilingual supportHelp available every day
- Free demo accountUS$10,000 virtual to practice
Trading involves the risk of losing the capital invested.
