

 Português pt
 Español es
 العربية ar
 বাংলা bn
 Deutsch de
 Filipino fil
 Français fr
 हिन्दी hi
 Bahasa Indonesia id
 Italiano it
 Русский ru
 Svenska sv
 ไทย th
 Türkçe tr
 Tiếng Việt vi
 简体中文 zh
Updated:
Indicators5 Indicators for Fast Trades, With Real Examples
 Naomi TanakaEditorial character · Analysis Desk

Quick answer
The five indicators most used in fast trades are exponential moving averages (direction), the RSI (strength and excess), the MACD (change in pace), Bollinger Bands (stretched price) and volume (participation). Each answers a different question, and signals become more reliable when they agree with each other and with the price's direction.
In short-term trades, the time to decide is small and the temptation to fill the chart with indicators is big. Five families show up in almost every short-term setup because each answers a different question: what's the direction, how much strength does the move have, whether the pace is changing, whether the price is stretched, and whether there's real participation behind the move.
To show what each one says in practice, we used Ethereum's real daily quotes (ETH/USDT on Binance) between May and October 2026. The same indicators work on minute charts; the reading logic is the same, but signals show up much more often and with more noise.
The 5 indicators and what each one answers
1. Exponential moving averages: direction
The exponential moving average (EMA) gives more weight to recent prices and so reacts faster than the simple moving average. A common pair for short trades is 9 and 21 periods: the short average above the long one signals a short-term uptrend. It says nothing about the strength of the move.
2. RSI: strength and excess
The RSI ranges from 0 to 100 and compares recent gains and losses. Above 70 signals overbought; below 30, oversold. In fast trades, these readings work more as a warning that the move is stretched than as an entry signal.
3. MACD: a change in pace
The MACD is the difference between the 12- and 26-period exponential moving averages. The signal line is a 9-period average of the MACD itself, and the histogram shows the gap between the two. When the MACD crosses above the signal line, the pace is turning bullish; below, bearish. Because it's built from averages, it arrives with a lag.
4. Bollinger Bands: is the price stretched?
These are a 20-period average with two bands set two standard deviations away. Closes outside the bands show unusual moves; narrow bands show a calm market, which often precedes a strong move.
5. Volume: is there real participation?
A move with volume well above average has more people behind it. A simple way to measure it is to divide the candle's volume by the average of the last 20: a result above 2 signals unusually high participation.

Real example: Ethereum with MACD in 2026
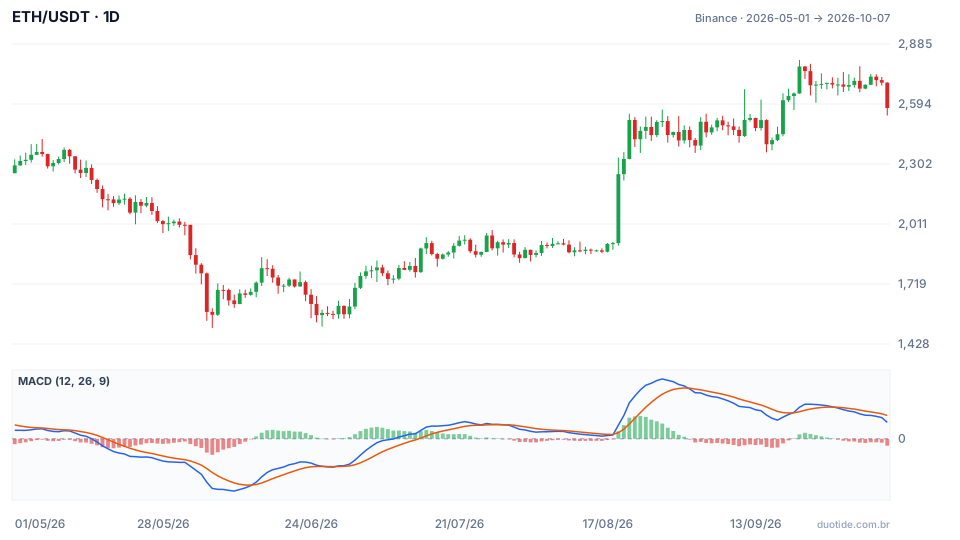
ETH closed at $2,295.63 on May 1, 2026 and at $2,574.14 on October 7, up 12.1%, with a sharp drop in June and a sharp rally in August in between. Three moments show how the five indicators combine:
June: every sign of exhaustion, and the price fell further
On June 5, 2026, ETH closed at $1,583.40, down 10.6% in a day, below the lower Bollinger band ($1,725.48), with volume 3.6 times the 20-day average and the RSI at 13.05. Everything looked like exhaustion. The next day the price still fell to $1,505.68, the low of the period. The MACD crossed above the signal line on June 14, at $1,725.62, but ten days later ETH was at $1,622.17, 6% lower. The 9-period EMA was still below the 21-period one: the MACD crossover was going against the direction.
August: all five indicators on the same side
On August 19, ETH jumped from $1,917.85 to $2,252.80, up 17.5% in a day, with volume 4.35 times the average. The close was above the upper band ($2,070.44), the RSI hit 82.24, the MACD crossed above the signal line, and the 9-period EMA was already above the 21-period one. Instead of correcting for being overbought, the price rose a further 11.7% to $2,516.30 on August 21. When direction, volume and pace agree, a high RSI shows strength, not the end of the move.
September: the MACD warned first
On September 28, the MACD crossed below the signal line with ETH at $2,688.71, while the 9-period EMA ($2,672.30) was still above the 21-period one ($2,599.37). The price drifted sideways for a week and closed on October 7 at $2,574.14, 4.3% lower, with the RSI at 45.35. The MACD showed the loss of pace before the averages did.
The three cases describe what happened, not what's going to happen.
How to use the indicators in fast trades
One indicator per question
Use the moving averages for direction, RSI or MACD for pace, Bollinger to tell whether the price is stretched, and volume to confirm. Two indicators that answer the same question, like RSI and Stochastic, don't confirm one another: they just repeat.
Trade with the direction
The June case shows the risk of buying just because the RSI is low and the price poked through the lower band. Require that the direction, per the averages, agree with the entry.
Adjust to the chart's timeframe
On 1- or 5-minute charts, the same indicators generate dozens of signals a day, most of them noise. Check the direction on a bigger timeframe before trading on the smaller one.
Limitations
All five are calculated from past price and volume. None of them anticipates news, and all of them lag during sharp reversals. In crypto, volume varies a lot between exchanges, so the volume measure only holds for the source you're looking at.

Common mistakes with short-term indicators
- Stacking similar indicators and thinking more matching signals increase certainty.
- Selling just because the RSI passed 70 on a move with strong volume.
- Buying just because the price closed below the lower band.
- Using the MACD crossover against the direction of the moving averages.
- Changing parameters after every losing trade.
- Ignoring volume and treating every breakout as the same.
On a demo account, build a chart with the five tools on the asset you follow and, for a few weeks, note every time they all agree and every time they diverge, along with what the price did afterward. That record will show which combinations make sense for you before any trade with real money.
Practice before you risk. Open your Duotide account and test your ideas on the demo account with US$10,000 in virtual funds.
Create free accountUpdated:
Editorial character of the Duotide newsroom. Articles are written by the team with the help of artificial intelligence; prices and charts come from real market data. Explains charts, indicators and trading strategies: how they work, where they fail and how to test them first.
Was this article helpful?
Be the first to rate it.
Comments
- No comments yet. Be the first to comment.
Ready to put it into practice?
Open your account and practice on the demo account with US$10,000 in virtual funds, without risking money.
- Secure platformProtected login and identity verification
- Multilingual supportHelp available every day
- Free demo accountUS$10,000 virtual to practice
Trading involves the risk of losing the capital invested.
