

 Português pt
 Español es
 العربية ar
 বাংলা bn
 Deutsch de
 Filipino fil
 Français fr
 हिन्दी hi
 Bahasa Indonesia id
 Italiano it
 Русский ru
 Svenska sv
 ไทย th
 Türkçe tr
 Tiếng Việt vi
 简体中文 zh
Updated:
IndicatorsWhat Is the ATR (Average True Range) and How to Calculate It
 Naomi TanakaEditorial character · Analysis Desk

Quick answer
The ATR (Average True Range) is a volatility indicator that shows how much an asset moves, on average, per period, including gaps. It's Wilder's average of the True Range over the last 14 periods and comes out in the same unit as the price. The ATR doesn't indicate direction: it's used to set stop distance and position size according to the asset's real behavior.
Most indicators try to say something about price direction. The Average True Range (ATR) doesn't: it only measures the size of the move. That's why it shows up in so many strategies — it answers a question every trader needs to ask before entering: how much does this asset usually move on a normal day?
In this guide we use gold's real daily quotes (the futures contract traded in New York, Yahoo Finance data) between April and October 2026 to show the step-by-step calculation, what the ATR showed over this period, and how it factors into sizing a stop and a position.
What the ATR Is
The ATR was introduced by J. Welles Wilder in 1978, in the same book where he unveiled the RSI and the ADX. It's the average of the so-called True Range over the last periods, typically 14. The result comes out in the same unit as the price: an ATR of 93 on gold means the metal had been moving, on average, about $93 a day, gaps included.
Two points define the indicator. First, it has no fixed scale, unlike the RSI's 0 to 100; the value depends on the asset's price. Second, it carries no sign: a sharp drop and a sharp rally produce a similar ATR, because the calculation uses absolute values.

How to Calculate the ATR
Step 1: Each Day's True Range
If you only used high minus low, you'd miss gaps, when the price opens far from the previous close. That's why the True Range is the largest of three values:
- The day's high minus the day's low;
- The day's high minus the previous close, in absolute value;
- The day's low minus the previous close, in absolute value.
Take gold's 09/28/2026 session. The previous close, from 09/25, was $4,321.20. On the 28th, the high was $4,315.60 and the low, $4,143.10.
- High − low = 4,315.60 − 4,143.10 = 172.50
- |High − previous close| = |4,315.60 − 4,321.20| = 5.60
- |Low − previous close| = |4,143.10 − 4,321.20| = 178.10
The day's True Range was $178.10, not the candle's $172.50, because gold had already opened below Friday's close.
Step 2: Wilder's Average
The first ATR is the simple average of the first 14 True Ranges. From there, each new value uses Wilder's smoothing:
Today's ATR = (yesterday's ATR × 13 + today's TR) ÷ 14
On 10/07/2026, gold had a high of $4,197.80 and a low of $4,091.20, with a previous close of $4,187.10. The three calculations give 106.60, 10.70, and 95.90, so the TR was 106.60. The 10/06 ATR stood at 92.41:
- 92.41 × 13 = 1,201.33
- 1,201.33 + 106.60 = 1,307.93
- 1,307.93 ÷ 14 = 93.42
The platform shows 93.43, because it uses the previous ATR unrounded. Notice that a day with a range well above average only raised the ATR by about $1: the smoothing makes the indicator react gradually, measuring recurring volatility rather than a single spike.
Real Example: Gold's ATR in 2026
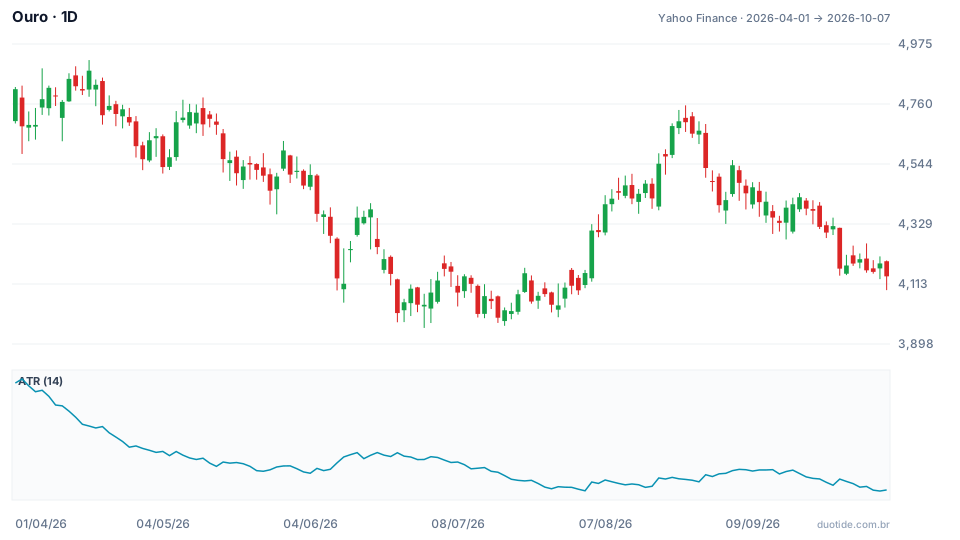
The chart shows gold's price and, in the panel below, the 14-day ATR. Between 04/01 ($4,813.10) and 10/07 ($4,140.70) the metal fell 13.97%, with a high of $4,917.70 on 04/17 and a low of $3,955.40 on 06/30. Three moments help explain the indicator:
April: Volatility at the Top of the Scale
On 04/02 the ATR reached 196.48, the window's highest value, with gold at $4,679.70. That equals 4.2% of the price per day. On that single day alone the True Range was $245.50. Anyone using a fixed $100 stop would have been within the market's normal noise.
July to October: Volatility Drops by Half
Over the following months, the ATR retreated almost continuously. On 10/06 it marked 92.41, the period's lowest value, and closed 10/07 at 93.43, or 2.26% of the price. Gold was still expensive and still swung a lot in dollar terms, but the typical daily range had fallen to less than half of April's.
September 28: the Gap That Moves the ATR
The day from the calculation example, 09/28, had a True Range of 178.10, nearly double the average. The ATR jumped from 97.78 to 103.52 in a single day and then went back to declining as the following sessions came in calmer. This is the typical pattern: the indicator rises quickly on shock days and falls slowly.

How to Use the ATR
Stop Distance
Instead of picking a fixed stop in dollars or points, many traders set the stop at a multiple of the ATR, like 1.5 or 2 times. With gold closing at $4,140.70 on 10/07 and an ATR of 93.43, a 2-ATR stop on a long position would sit at 4,140.70 − 186.86 = $3,953.84. The idea is to keep the stop outside the asset's usual swing.
Position Size
The ATR also adjusts position size so the dollar risk stays constant. Suppose a $10,000 account that accepts losing 1% per trade, or $100, with a 2-ATR stop:
- On 04/02: a stop of 2 × 196.48 = $392.96 per ounce → 100 ÷ 392.96 = 0.25 ounce
- On 10/07: a stop of 2 × 93.43 = $186.86 per ounce → 100 ÷ 186.86 = 0.54 ounce
With volatility cut in half, the same rule allows a position twice as large with the same dollar risk. In April, October's position would have risked more than double.
Comparing Assets and Moments
To compare assets with different prices, divide the ATR by the price. Gold with an ATR of 2.26% of its price behaves differently from a stock with a 4% ATR or a currency pair with an ATR below 1%. The same applies to comparing the same asset across different phases, like April and October.
Limitations
The ATR looks backward: after a big piece of news, it still takes a few days to reflect the new volatility. It also says nothing about direction, and it doesn't warn when a shock is about to happen. And a 2-ATR stop reduces the chance of being hit by noise, but it doesn't prevent gaps that jump right over the stop.
Common Mistakes When Using the ATR
- Treating a high ATR as a bullish signal or a low ATR as a bearish one: the indicator measures size, not direction.
- Comparing ATR in absolute value between assets with very different prices, without dividing by the price.
- Using the same point stop all year, ignoring that the asset's volatility has changed.
- Keeping the same position size when the ATR doubles, which also doubles the trade's real risk.
- Forgetting that the examples above show what happened in the period, not what will happen.
To practice without risking money, open the chart of the asset you follow in a demo account, add the 14-period ATR, and, before each simulated trade, note the ATR, the stop distance, and the position size. After a few weeks, compare how many stops got hit by noise with and without the ATR rule.
Practice before you risk. Open your Duotide account and test your ideas on the demo account with US$10,000 in virtual funds.
Create free accountUpdated:
Editorial character of the Duotide newsroom. Articles are written by the team with the help of artificial intelligence; prices and charts come from real market data. Explains charts, indicators and trading strategies: how they work, where they fail and how to test them first.
Was this article helpful?
Be the first to rate it.
Comments
- No comments yet. Be the first to comment.
Ready to put it into practice?
Open your account and practice on the demo account with US$10,000 in virtual funds, without risking money.
- Secure platformProtected login and identity verification
- Multilingual supportHelp available every day
- Free demo accountUS$10,000 virtual to practice
Trading involves the risk of losing the capital invested.
