

 Português pt
 Español es
 العربية ar
 বাংলা bn
 Deutsch de
 Filipino fil
 Français fr
 हिन्दी hi
 Bahasa Indonesia id
 Italiano it
 Русский ru
 Svenska sv
 ไทย th
 Türkçe tr
 Tiếng Việt vi
 简体中文 zh
Updated:
IndicatorsMACD, Stochastic, and Parabolic SAR: How to Combine the Three Indicators
 Naomi TanakaEditorial character · Analysis Desk

Quick answer
The most useful way to combine the three is as a funnel: Parabolic SAR sets the direction, MACD confirms the strength of the move, and the Stochastic helps pick the entry timing, avoiding buying with the price overextended. Since MACD and SAR are both trend-following and tend to turn together, they shouldn't be counted as two independent confirmations, and the combination loses effectiveness in a sideways market.
Beginners often stack indicators on the chart hoping for more confidence in their entries, without realizing that a good chunk of them measure the same thing under different names. MACD, Stochastic, and Parabolic SAR show up together on many platforms, but two of them are close relatives, and that changes the right way to combine them.
In this guide we use real daily prices for Nvidia (NVDA, Yahoo Finance data) from April to October 2026 to show how each indicator is calculated, how much MACD and SAR overlap in practice, and where the combination helped or got in the way.
What each indicator measures
- MACD: the distance between two exponential moving averages. It measures the trend's momentum and signals changes when the MACD line crosses the signal line.
- Stochastic: where the close sits within the range between the recent high and low. It measures short-term extremes, on a scale from 0 to 100.
- Parabolic SAR: dots below the price in an uptrend and above it in a downtrend. It sets the direction and serves as a reference for a trailing stop.
MACD and SAR are from the same family: both follow trend. The Stochastic is from another: it measures whether the price is overextended. That's why the combination makes sense as a funnel (context, confirmation, entry timing), not as three independent votes.

How to calculate the three indicators
MACD
MACD = 12-period exponential average − 26-period exponential average. The signal line is the 9-period exponential average of the MACD itself, and the histogram is the difference between the two. On October 7, 2026, Nvidia's 12-day average stood at $231.57 and the 26-day at $226.67: MACD = 231.57 − 226.67 = 4.90. With the signal line at 3.63, the histogram came to 4.90 − 3.63 = 1.27, positive.
Stochastic
%K = 100 × (close − 14-period low) ÷ (14-period high − 14-period low). The %D line is the 3-period average of %K. On May 29, 2026, the 14-session high was $236.54 (May 14), the low $208.78 (May 27), and the close $211.14:
- Close − low: 211.14 − 208.78 = 2.36
- High − low: 236.54 − 208.78 = 27.76
- %K = 100 × 2.36 ÷ 27.76 = 8.5, well below 20
Parabolic SAR
Tomorrow's SAR = today's SAR + AF × (EP − today's SAR), where EP is the trend's extreme point (the highest high, in an uptrend) and AF is the acceleration factor, which starts at 0.02 and rises by 0.02 with every new high, up to 0.20. On September 28, 2026, Nvidia's high ($233.21) moved past the bearish SAR, and the indicator flipped to bullish, starting at the extreme low of the previous decline, $208.93. The next day: 208.93 + 0.02 × (233.21 − 208.93) = 209.42. SAR values can vary slightly between platforms, depending on the calculation's starting point.
Real example: the three indicators on Nvidia in 2026
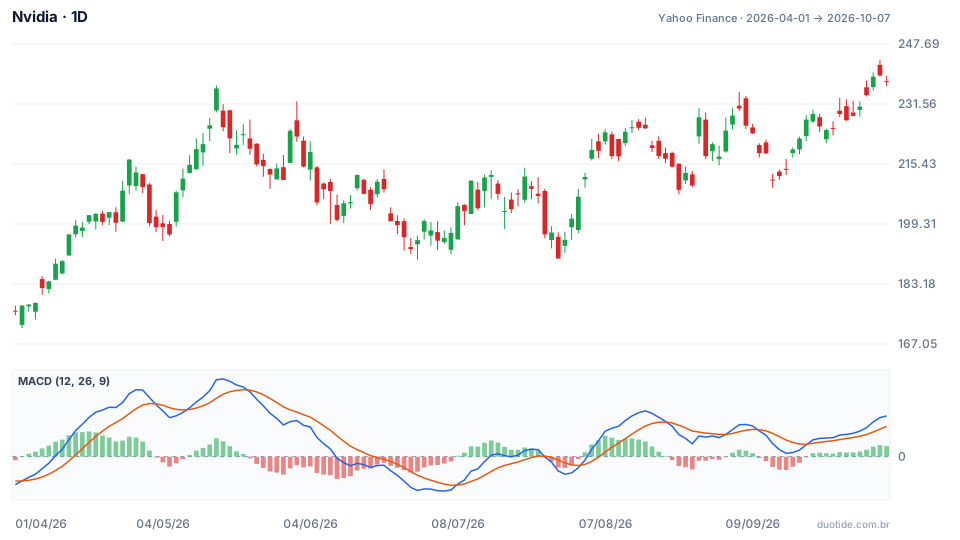
The chart shows the MACD; the Stochastic (14, 3) and SAR (0.02; 0.20) values cited below were calculated on the same price data.
MACD and SAR say almost the same thing
Between April and October, the SAR changed direction 13 times. In 8 of those flips, the MACD crossed the signal line on the same session or within one session: on July 8, July 27, and August 4, the two flipped on exactly the same day. Using both as independent confirmation would mean counting the same signal twice.
August and September: the combination in a sideways market
Between July 27 and September 25, Nvidia closed every day between $190.01 and $230.36, with no clear direction. Over that stretch, the SAR flipped five times (July 27, August 4, August 20, August 27, and September 14). On August 4, SAR and MACD flipped bullish together, with the price at $211.94; ten sessions later, on August 18, the price was at $219.74 (+3.7%), and the SAR had already flipped bearish on August 20. On September 3, the MACD crossed up with the SAR already bullish, at $228.45, and on September 14 the SAR flipped bearish at $210.96. Both trend indicators got it wrong together, because there was no trend.
Late September: disagreement, then alignment
On September 22, the MACD crossed up (price at $228.87) while the SAR was still above the price, bearish. Under the funnel approach, that disagreement called for waiting. On September 28, the SAR flipped bullish, at $228.86, and the two fell into agreement. Except the Stochastic was at 82.1, above 80: the price was already overextended in the short term. Anyone waiting for the Stochastic to pull back near 20 wouldn't have had an entry until October 7, when the stock closed at $237.47, 3.8% above the September 28 level. The wait rule protects against buying overextended, but it also lets moves slip by.
These cases describe what happened with this stock over this period and don't indicate what will happen.

How to use the combination
1. The SAR sets the context
Dots below the price: look only for buys. Dots above: only sells. It's the funnel's first question: which direction would I trade with right now?
2. The MACD confirms, it doesn't duplicate
Since the MACD tends to turn along with the SAR, use it to gauge strength, not as a second vote. A growing histogram in the SAR's direction reinforces the context; a shrinking histogram while the SAR stays in the same direction is a sign of weakening strength. Disagreement between the two is a reason to wait.
3. The Stochastic fine-tunes the timing
With context and momentum aligned, the Stochastic helps avoid overextended entries: in an uptrend, pullbacks into the 20-to-40 range tend to offer a better risk-to-reward ratio than entering with the indicator above 80. In a downtrend, the opposite.
4. The SAR as a trailing stop
After entering, the SAR's own dot can serve as a reference for the stop, which rises every day in an uptrend. On September 29, for example, the stop would be at $209.42, about 8% below the price; the distance shortens as the trend advances and the acceleration factor grows.
Limitations
All three indicators are calculated only from past price. In a sideways market, MACD and SAR generate flip after flip, as happened in August and September on Nvidia, and the Stochastic doesn't fix that. The combination doesn't eliminate false signals: it only lowers the odds of trading just because one single number crossed a line.
Common mistakes when combining MACD, Stochastic, and SAR
- Counting MACD and SAR as two independent confirmations, when they tend to flip on the same day.
- Using the combination in a sideways market, where the two trend indicators get it wrong together.
- Buying just because the Stochastic is below 20, against a bearish SAR.
- Ignoring the disagreement between SAR and MACD and picking whichever indicator confirms the idea you already had.
- Changing the default parameters without testing: a SAR with a larger acceleration factor flips much more often.
- Forgetting that past examples don't guarantee the outcome of future trades.
To practice without risking money, set up all three indicators on the daily chart of an asset in a demo account and record, over a few weeks, every time the three lined up: date, price, Stochastic value, and where the SAR was. Also note what happened over the following ten sessions. This log shows whether the funnel works on the asset you follow.
Practice before you risk. Open your Duotide account and test your ideas on the demo account with US$10,000 in virtual funds.
Create free accountUpdated:
Editorial character of the Duotide newsroom. Articles are written by the team with the help of artificial intelligence; prices and charts come from real market data. Explains charts, indicators and trading strategies: how they work, where they fail and how to test them first.
Was this article helpful?
Be the first to rate it.
Comments
- No comments yet. Be the first to comment.
Ready to put it into practice?
Open your account and practice on the demo account with US$10,000 in virtual funds, without risking money.
- Secure platformProtected login and identity verification
- Multilingual supportHelp available every day
- Free demo accountUS$10,000 virtual to practice
Trading involves the risk of losing the capital invested.
