

 Português pt
 Español es
 العربية ar
 বাংলা bn
 Deutsch de
 Filipino fil
 Français fr
 हिन्दी hi
 Bahasa Indonesia id
 Italiano it
 Русский ru
 Svenska sv
 ไทย th
 Türkçe tr
 Tiếng Việt vi
 简体中文 zh
Updated:
IndicatorsWhat Is the Stochastic Oscillator and How to Calculate It
 Naomi TanakaEditorial character · Analysis Desk

Quick answer
The stochastic oscillator is a momentum indicator that shows, on a scale from 0 to 100, where the current close sits within the range between the high and the low of the last 14 periods. It has two lines, %K and %D (a 3-period average of %K). Above 80 signals overbought and below 20, oversold, but in a strong trend the indicator can sit in those zones for days without the price turning.
The stochastic oscillator is one of the oldest indicators in technical analysis and remains among the most used, especially in the currency market. The idea behind it is simple: in an uptrend, closes tend to sit near recent highs; in a downtrend, near the lows. The indicator measures exactly that.
In this guide we use EUR/USD's real daily quotes (Yahoo Finance data) between April and October 2026 to show the calculation of %K and %D and what the 80 and 20 zones actually showed.
What the Stochastic Oscillator Is
The stochastic was popularized by George Lane in the 1950s. It shows where the current close sits within the range between the high and the low of the last N periods, on a scale from 0 to 100. A value of 100 means the close landed exactly at the period's high; 0, exactly at the low.
The indicator has two lines:
- %K: the main line, with a standard period of 14;
- %D: a 3-period simple average of %K, which works as a signal line.
Above 80, the asset is considered overbought; below 20, oversold. These zones tell you where the price closed within the recent range, not that it's about to turn.

How to Calculate the Stochastic
The %K formula is:
%K = 100 × (close − lowest low of 14 days) ÷ (highest high of 14 days − lowest low of 14 days)
And %D is the average of the last three %K values.
Example With Real EUR/USD Data
We took the 14 sessions from 09/18/2026 to 10/07/2026:
- Period's highest high: 1.14945 (09/21)
- Period's lowest low: 1.11623 (10/05)
- 10/07 close: 1.12535
- %K = 100 × (1.12535 − 1.11623) ÷ (1.14945 − 1.11623) = 100 × 0.00912 ÷ 0.03322 = 27.45
- %D = (23.45 + 16.31 + 27.45) ÷ 3 = 22.40, using the %K from 10/05, 10/06, and 10/07
In words: on 10/07 the euro closed 27% of the way between the low and the high of the last three weeks, above the oversold zone, and %K was above %D, a sign that the close had been improving over the previous days.
Real Example: EUR/USD's Stochastic in 2026
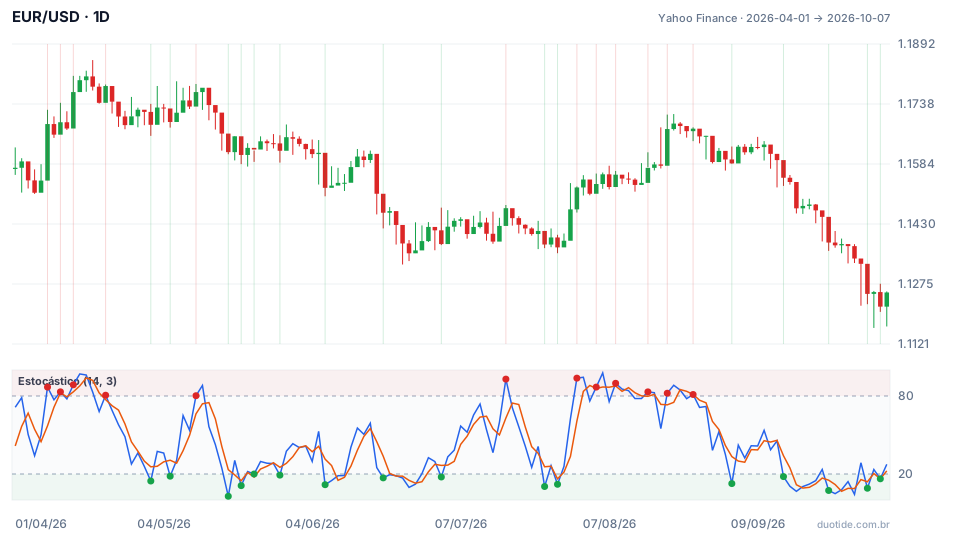
In the chart, the blue line is %K and the orange one, %D. The red dots mark %K's moves above 80 and the green ones, below 20. Between 04/01 (1.1574) and 10/07 (1.1254) the pair fell 2.77%, with a high of 1.1851 on 04/17 and a low of 1.1162 on 10/05. Over 136 sessions, %K moved above 80 twelve times and below 20 sixteen times. What happened afterward varied a lot.
Late July: Oversold That Worked
On 07/24 %K fell to 10.4 with the pair at 1.1377, and on 07/28, to 12.1, at 1.1369. Ten sessions later, EUR/USD stood at 1.1525 and 1.1546, gains of 1.3% and 1.56%. This is the textbook use: price stretched down in a market with no strong trend, followed by a reaction.
August: Overbought That Didn't Bring the Price Down
On 08/06 %K reached 97.75, the window's highest value, with the pair at 1.1557. Anyone selling on overbought watched the euro rise to 1.1674 ten sessions later and close at 1.1688 on 08/21. In an uptrend, closing near the high is exactly the normal behavior.
September: Repeated Oversold Readings in a Downtrend
%K dropped below 20 on 09/03 (1.1585), on 09/15 (1.1549), and on 09/24 (1.1382). In none of the three cases did the price react: ten sessions after 09/03 the pair was at 1.1470, 115 pips lower; after 09/15, at 1.1373; and from 09/24 through 10/07 it fell to 1.1254. In a downtrend, the stochastic can sit in the oversold zone for days while the price keeps falling.

How to Use the Stochastic
The 80 and 20 Zones
They work best in a sideways market. Instead of acting as soon as %K enters the zone, many traders wait for it to leave: dropping back below 80 after overbought, or climbing back above 20 after oversold. This avoids much of what happened in September, when the indicator got stuck in the zone.
The %K and %D Crossover
%K crossing above %D suggests improving momentum; below it, worsening momentum. A crossover inside the extreme zones carries more weight than one in the middle of the scale, where it happens all the time.
With the Trend
A common combination: identify the trend with a moving average or the ADX and use the stochastic only in that direction. In a downtrend, as in September, use the moves above 80 as watch points for selling and ignore the oversold ones; in an uptrend, the opposite.
Divergences
When the price makes a new low and the stochastic makes a higher low, the downward move is losing strength. It's a warning sign, not an entry signal by itself.
Limitations
The stochastic is fast, and because of that, jumpy: it generates a lot of signals, 28 in just over six months in this example. It only uses price, knows nothing about news, and in strong trends its extreme zones lose almost all their value.
Common Mistakes When Using the Stochastic
- Selling every time %K crosses above 80 and buying every time it drops below 20, without checking the trend.
- Trading %K and %D crossovers in the middle of the scale, where they say almost nothing.
- Shortening the period (from 14 to 5, for example) without testing: the indicator gets even jumpier.
- Confusing the stochastic with the RSI: the first looks at where the close sits within the price range; the second, at the ratio between gains and losses.
- Forgetting that the examples above show what happened in the period, not what will happen.
To practice without risking money, open EUR/USD's chart or another pair's in a demo account, add the stochastic (14, 3), and log every entry into the 80 and 20 zones: the date, whether a trend was in place, and where the price stood ten sessions later. Within a few weeks you'll have your own record of when the signal helps.
Practice before you risk. Open your Duotide account and test your ideas on the demo account with US$10,000 in virtual funds.
Create free accountUpdated:
Editorial character of the Duotide newsroom. Articles are written by the team with the help of artificial intelligence; prices and charts come from real market data. Explains charts, indicators and trading strategies: how they work, where they fail and how to test them first.
Was this article helpful?
Be the first to rate it.
Comments
- No comments yet. Be the first to comment.
Ready to put it into practice?
Open your account and practice on the demo account with US$10,000 in virtual funds, without risking money.
- Secure platformProtected login and identity verification
- Multilingual supportHelp available every day
- Free demo accountUS$10,000 virtual to practice
Trading involves the risk of losing the capital invested.
