

 Português pt
 Español es
 العربية ar
 বাংলা bn
 Deutsch de
 Filipino fil
 Français fr
 हिन्दी hi
 Bahasa Indonesia id
 Italiano it
 Русский ru
 Svenska sv
 ไทย th
 Türkçe tr
 Tiếng Việt vi
 简体中文 zh
Updated:
IndicatorsWhat Is the ADX Indicator and How to Calculate Trend Strength
 Naomi TanakaEditorial character · Analysis Desk

Quick answer
The ADX (Average Directional Index) is an indicator that measures a trend's strength on a scale from 0 to 100, without telling direction. Below 20 signals a market with no trend; above 25, a strong trend. Direction comes from the +DI and −DI lines that accompany the indicator: when +DI is on top, the strength is bullish; when −DI is on top, bearish.
Knowing whether the market is trending or moving sideways changes almost everything about a trade: the type of entry, the stop distance, and even whether it's worth trading at all. The ADX was created exactly to measure this. It doesn't say whether the price will rise or fall; it says whether the current move has strength or is just noise.
In this guide we use Nvidia's real daily stock quotes (NVDA, Yahoo Finance data) between March and October 2026 to show the calculation, what the indicator marked over this period, and where it helps or gets in the way.
What the ADX Is
The ADX (Average Directional Index) was introduced by J. Welles Wilder in 1978. It comes with two supporting lines:
- +DI: measures the strength of upward moves;
- −DI: measures the strength of downward moves;
- ADX: measures the smoothed distance between the two, on a scale from 0 to 100.
When one directional line dominates the other for several days, the ADX rises. When they stay close and cross frequently, the ADX falls. The classic reading is: ADX below 20 signals a market with no clear trend; above 25, a trend with strength. Direction comes from +DI and −DI, not from the ADX.

How to Calculate the ADX
The calculation has four steps, all with a standard period of 14:
- Directional movement: +DM is how much today's high exceeded yesterday's; −DM is how much today's low fell below yesterday's. Only the larger of the two counts for the day; the other becomes zero.
- Directional lines: +DI = 100 × Wilder's average of +DM ÷ ATR; −DI = 100 × Wilder's average of −DM ÷ ATR.
- DX: 100 × |+DI − −DI| ÷ (+DI + −DI).
- ADX: Wilder's average of the DX, or (yesterday's ADX × 13 + today's DX) ÷ 14.
Example With Real Nvidia Data
On 10/07/2026 NVDA's high was $239.08 and its low, $236.38. The previous day, the high had been $243.37 and the low, $238.93.
- Rise in the high: 239.08 − 243.37 = −4.29 (negative, so +DM = 0)
- Drop in the low: 238.93 − 236.38 = 2.55 → −DM = 2.55
- After the averages, +DI = 34.96 and −DI = 18.77
- DX = 100 × (34.96 − 18.77) ÷ (34.96 + 18.77) = 100 × 16.19 ÷ 53.73 = 30.13
- ADX = (18.64 × 13 + 30.13) ÷ 14 = 272.45 ÷ 14 = 19.46
Notice the double smoothing: the day's DX was 30, but the ADX rose less than a point. This is why the ADX is slow. It confirms trends already underway; it doesn't anticipate them.
Real Example: Nvidia's ADX in 2026
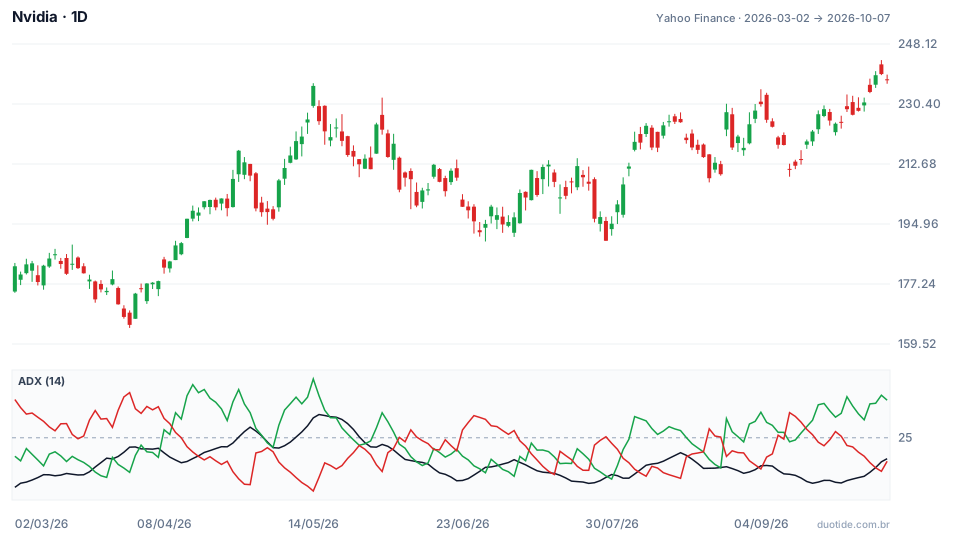
In the chart, the ADX is the dark line, +DI the green one, and −DI the red one; the dashed line marks 25. Between 03/02 ($182.48) and 10/07 ($237.47) the stock rose 30.13%, but nowhere near in a straight line.
April: the Lines Turned Before the ADX
On 03/30 NVDA closed at $165.17, near the period's low ($164.27), with the −DI at the window's highest value, 36.97. On 04/10 the +DI crossed above the −DI with the stock at $188.63, but the ADX stood at 19.1, still in the no-trend zone. The ADX only passed 25 on 04/27, with the price at $216.61, 14.8% above the crossover day. Anyone who waited for the ADX to confirm entered with much of the move already done.
May: the ADX Peak Near the Top
On 05/14 the stock closed at $235.74 and the +DI marked 40.58, its peak. The next day, 05/15, the ADX reached 31.16, the period's highest value, with the price already at $225.32. On 05/28 the ADX dropped back below 25 (23.69), with the stock at $214.25. A high ADX showed the strength of the rally, but the indicator's peak came along with the end of the move, not before it.
June to September: Sideways Action and Crossing Lines
Between 06/05 and 09/17, the +DI and −DI crossed 14 times, and the ADX spent most of the time below 20. The close ranged between $190.01 (07/29) and $230.36 (09/04) with no clear trend. Anyone trading every crossover of the directional lines would have switched sides 14 times. This is exactly the scenario a low ADX warns about: trend signals work poorly here.
In early October, the stock marked a high of $243.37 on 10/06, and the ADX was still at 18.64. A fresh high doesn't, by itself, mean a strong trend.

How to Use the ADX
As a Strategy Filter
The most common use is deciding which tool to apply. With the ADX above 25, trend-following strategies (breakouts, moving averages, buying pullbacks with the trend) tend to work better. With the ADX below 20, oscillators like the RSI and the stochastic, and trading between support and resistance, make more sense.
Direction From the DI Lines
The ADX has no direction: a sharp drop also makes the ADX rise. To know the side, look at which line is on top. +DI above −DI with the ADX rising signals an uptrend gaining strength; the opposite, a downtrend gaining strength.
The ADX's Slope
More than the level, the slope says a lot. A rising ADX means the trend is strengthening; an ADX falling from a peak, as in May, signals that the move has lost momentum, even if the price hasn't turned yet.
Limitations
Because it uses two layers of smoothing, the ADX lags quite a bit: in April, it confirmed the trend after a rally of almost 15%. The 20 and 25 levels are conventions, not laws, and they vary from asset to asset. And the indicator doesn't anticipate news or gaps.
Common Mistakes When Using the ADX
- Reading a high ADX as a buy signal: the ADX rises in both a strong rally and a strong drop.
- Trading every +DI and −DI crossover when the ADX is below 20, as between June and September.
- Waiting for the ADX to pass 25 and assuming you entered at the start of the trend.
- Ignoring the slope: a high but falling ADX tells a different story than a rising one.
- Forgetting that the examples above show what happened in the period, not what will happen.
To practice without risking money, open an asset's chart in a demo account, add the 14-period ADX with the +DI and −DI lines, and note, over a few weeks, which phase the market was in (ADX below 20, between 20 and 25, above 25) and how your simulated trades performed in each one.
Practice before you risk. Open your Duotide account and test your ideas on the demo account with US$10,000 in virtual funds.
Create free accountUpdated:
Editorial character of the Duotide newsroom. Articles are written by the team with the help of artificial intelligence; prices and charts come from real market data. Explains charts, indicators and trading strategies: how they work, where they fail and how to test them first.
Was this article helpful?
Be the first to rate it.
Comments
- No comments yet. Be the first to comment.
Ready to put it into practice?
Open your account and practice on the demo account with US$10,000 in virtual funds, without risking money.
- Secure platformProtected login and identity verification
- Multilingual supportHelp available every day
- Free demo accountUS$10,000 virtual to practice
Trading involves the risk of losing the capital invested.
