

 Português pt
 Español es
 العربية ar
 বাংলা bn
 Deutsch de
 Filipino fil
 Français fr
 हिन्दी hi
 Bahasa Indonesia id
 Italiano it
 Русский ru
 Svenska sv
 ไทย th
 Türkçe tr
 Tiếng Việt vi
 简体中文 zh
Updated:
StrategiesWhich Trading Strategy Fits You? 5 Personality Types
 Naomi TanakaEditorial character · Analysis Desk
Quick answer
The right strategy depends on your time and your temperament: patient profiles tend to do better following trends, quick profiles with breakouts, detail-oriented ones with support and resistance, busy people with swing trading and analytical profiles with tested rules. No profile eliminates risk; the fit just makes it easier to stick to your own rules.
There's no strategy that's best for everyone. There's the one that fits the time you have, the way you react to losses, and the speed at which you like to decide. Someone anxious for results will hardly hold a position for weeks; someone busy will hardly follow trades that require a decision every minute. When the strategy fights the temperament, the trader ends up breaking their own rules.
To show that each profile sees different opportunities in the same chart, we used gold's real daily quotes (GC=F futures contract, Yahoo Finance) between April and October 2026, along with the ADX, an indicator that measures trend strength.
What the ADX shows
The ADX (Average Directional Index) ranges from 0 to 100 and measures trend strength, without indicating direction. Readings above 25 tend to signal a strong trend; below 20, a directionless market. Direction comes from two supporting lines: the +DI (buying strength) and the −DI (selling strength). When the +DI is above the −DI, the pressure is bullish; the reverse means bearish.
The ADX is useful here because each trader profile works best in a different phase of the market: some in a trend, others in sideways conditions.

Real example: gold's phases in 2026
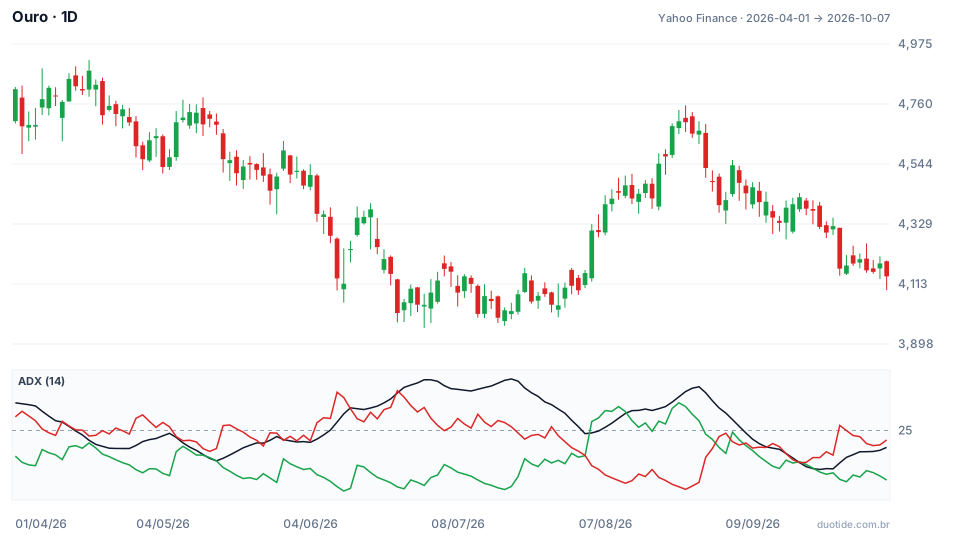
Gold opened the window at $4,813.10 per ounce on April 1, 2026 and closed at $4,140.70 on October 7, down 14%. But the path went through quite different phases:
April and May: a market with no trend
The ADX fell from 32.3 on April 1 to 17 on May 14. Between April 1 and May 15, closes stayed between $4,533.30 and $4,879.60, a back-and-forth with no clear direction.
June and July: a downtrend
The −DI took the lead and the ADX climbed to 38.51 on July 20. From the close of $4,505.00 on June 4 to the low of $3,955.40 on June 30, the drop was 12.2%.
August: an uptrend
On August 5, gold rose 3.7% in a single day, from $4,152.60 to $4,305.20, and the +DI (27.35) moved ahead of the −DI (15.76). The ADX crossed 25 on August 7. By August 25, the close had reached $4,694.50, a further 9.0% from August 5.
September: back to sideways
The ADX fell to 14.77 on September 23, the lowest value in the window. Across the entire period, the ADX stayed above 25 on 68 of the 131 trading days, just over half.
The 5 profiles and the strategies that fit each one
1. Analytical and patient: follow the trend
Likes to study calmly and doesn't mind waiting days for a result. Fits trend following over longer timeframes: enters only when the ADX confirms strength and holds while the trend lasts. In 2026 this profile would have caught gold's two clear phases, the June drop and the August rally, and would have had to accept sitting out or taking small losses in April, May and September.
2. Decisive and quick: breakouts
Decides fast and isn't shaken by pressure. Fits trading breakouts of support or resistance confirmed by volume. August 5 is exactly the kind of candle this profile looks for. Needs very clear risk rules, because the same quickness leads to impulsive entries on false breakouts.
3. Structured and detail-oriented: price action at support and resistance
Likes to map out the chart before any decision. Fits trading reactions at already-marked regions, like the edges of the April-May range. Works best precisely when the ADX is low; in a strong trend, levels are broken through easily.
4. Busy: swing trading with few signals
Has little time during the day. Fits swing trading decided at the daily close: checks the chart once a day, adjusts stops and orders, and goes on with life. Fewer trades, each with a stop and a target set in advance.
5. Curious and data-driven: tested rules
Likes numbers and testing hypotheses. Fits strategies with objective rules, such as only trading in the direction of the +DI or the −DI when the ADX passes 25, tested on historical data before use. The risk for this profile is overfitting: tweaking the rule until it works perfectly in the past and fails in the future.

How to find your profile
Keep a journal for a few weeks
Write down every decision and how you felt: rushed, anxious, bored, confident. Patterns show up quickly. Anyone who exits every trade before the target probably isn't the patient type.
Measure the time you actually have
Count the free hours during market hours in a normal week, not an ideal one.
Limitations
Profiles are simplifications; many people have traits of two or three. And the market shifts phase without warning: the strategy that fits you will go through rough patches, like the trend follower in September. The gold examples describe what happened, not what's going to happen.
Common mistakes when choosing a strategy by profile
- Choosing a strategy based on results someone showed on social media, instead of the routine you actually have.
- Switching strategies every time the market changes phase.
- Trading breakouts in a sideways market or reversals in a strong trend without checking the ADX or another filter.
- Thinking that knowing your own profile replaces a stop and risk control.
- Tweaking the strategy until it looks perfect in hindsight.
Pick the profile that sounds most like you, apply the matching strategy on a demo account for a few weeks, and log each trade along with how you felt during it. If the rules get broken often, the problem may be the fit between strategy and temperament, not the strategy itself.
Practice before you risk. Open your Duotide account and test your ideas on the demo account with US$10,000 in virtual funds.
Create free accountUpdated:
Editorial character of the Duotide newsroom. Articles are written by the team with the help of artificial intelligence; prices and charts come from real market data. Explains charts, indicators and trading strategies: how they work, where they fail and how to test them first.
Was this article helpful?
Be the first to rate it.
Comments
- No comments yet. Be the first to comment.
Ready to put it into practice?
Open your account and practice on the demo account with US$10,000 in virtual funds, without risking money.
- Secure platformProtected login and identity verification
- Multilingual supportHelp available every day
- Free demo accountUS$10,000 virtual to practice
Trading involves the risk of losing the capital invested.
