

 Português pt
 Español es
 العربية ar
 বাংলা bn
 Deutsch de
 Filipino fil
 Français fr
 हिन्दी hi
 Bahasa Indonesia id
 Italiano it
 Русский ru
 Svenska sv
 ไทย th
 Türkçe tr
 Tiếng Việt vi
 简体中文 zh
Updated:
IndicatorsThe 50-Period Moving Average: How to Use It in Practice
 Naomi TanakaEditorial character · Analysis Desk

Quick answer
The 50-period moving average is the average of the last 50 closes and serves as a medium-term trend reference: price above it with a rising average signals a bullish bias; below it with a falling average, a bearish one. It also works as dynamic support or resistance on pullbacks. It's a lagging indicator, and it misfires in sideways markets and sharp drops.
Among the dozens of possible settings for a moving average, the 50-period one occupies a special spot. It doesn't react to every wiggle, like a 9- or 21-period average, nor is it as slow as the 200-period one, used for very long-term trends. That middle ground makes it one of the most watched lines among traders working stocks, currencies, and indices on the daily chart.
In this guide we use real daily prices for Apple (Yahoo Finance) from February to October 2026 to show how the 50-period average is calculated and what it actually showed.
What the 50-period moving average is
It's the arithmetic average of the last 50 closes, recalculated with every new candle. On the daily chart, it covers about two and a half months of sessions; on the 1-hour chart, the last 50 hours. When the price is above it and it's sloping up, the medium-term bias is bullish; below it and sloping down, bearish.

How to calculate the 50-period average
Add up the last 50 closes and divide by 50. On October 7, 2026, the sum of Apple's 50 closes through that day was $16,113.99. Dividing by 50: $322.28. The day's close was $336.67, 4.47% above the average.
The next day, the oldest close drops out of the calculation and the new one enters. On October 7, July 28's close ($340.08) dropped out and October 7's ($336.67) came in. Since the price coming in was lower than the one going out, the average ticked down slightly. That's how the average's slope shows direction: it rises as long as the new prices are higher than the old ones.
Real example: the 50-period average on Apple in 2026
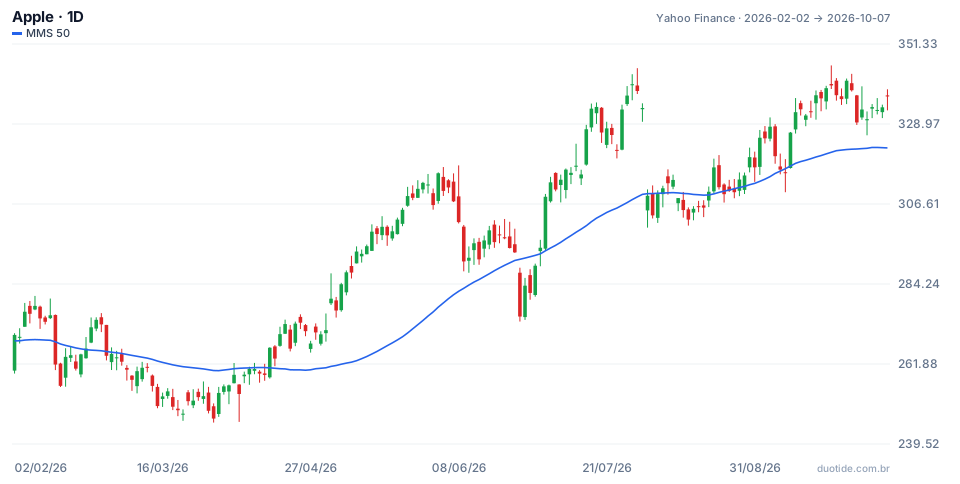
Over the chart's period, the stock went from $270.01 (February 2) to $336.67 (October 7), up 24.69%, with a low of $245.51 on March 30 and a high of $345.34 on September 22. The stock closed above the 50-period average in 117 of 172 sessions.
February and March: the filter that avoided buys
On February 27, Apple closed at $264.18, below the average ($265.38). Over the following weeks the price pulled further away below it: on March 30 it was 5.16% below the line, with a low of $245.51, 7.1% below the February 27 close. Anyone using the average as a trend filter wouldn't have bought during this stretch. The move back above the average only came on April 15, at $266.43.
June: a break that didn't confirm
On June 25, the stock fell 6.1% in a single day, from $293.08 to $275.15, closing 5.5% below the average ($291.15). It looked like the end of the rally. By July 1 it was already back above it, at $294.38, and ten sessions later it closed at $333.26. That's the downside of the average: a close below it isn't always the start of a drop.
August and September: the average as support
On August 5, the price touched the average (close of $311.00, average of $309.65). On August 12, it closed a bit below, at $302.25, with a low of $300.57, and on August 18 it moved back up, to $310.03. Anyone buying there with a stop below the August 12 low would have risked $9.46 per share (3.1%); ten sessions later the stock was at $325.13 (+4.9%). On September 9, the pattern repeated: a low of $309.90, a close just below the average, and on September 10 a rise to $326.57. The period's high came on September 22.

How to use the 50-period average
As a trend filter
The simplest rule: look for buys only with the price above the 50-period average and the average sloping up, and look for sells only in the opposite case. The filter doesn't give the entry timing, but it keeps you from trading against the flow, as in March.
As dynamic support and resistance
In an uptrend, pullbacks to the average tend to be points of interest, as in August and September. Wait for a close back above the line before acting, and place the stop below the pullback's low. In a downtrend, the average works as a ceiling.
Together with the 200-period average
The 50-period average crossing above the 200-period one is the golden cross; crossing below is the death cross. On October 7, 2026, Apple's 200-period average was at $290.08, below the 50-period one: both were pointing up. These crossovers confirm long trends, but they arrive late.
Limitations
The 50-period average is calculated from past prices and reacts slowly. In sharp drops, like the one on June 25, it lags behind; in a sideways market, the price crosses it repeatedly and generates false signals. It also knows nothing about quarterly earnings or news.
Common mistakes when using the 50-period average
- Selling on every close below the average without waiting for confirmation, as would have happened on June 25.
- Buying on every touch of the average even when it's sloping down.
- Placing the stop exactly on the average, where the price often just grazes by.
- Using the 50-period average on the 5-minute chart as if it carried the same weight as the one on the daily chart.
- Forgetting that the examples describe what happened, not what will happen.
To practice, open the daily chart of a stock you follow on a demo account, add the 50-period average, and note, over a few weeks, every touch and every crossover: what the price did afterward, where the stop would be, and what the result would have been. This log will show how the average behaves on the asset you trade.
Practice before you risk. Open your Duotide account and test your ideas on the demo account with US$10,000 in virtual funds.
Create free accountUpdated:
Editorial character of the Duotide newsroom. Articles are written by the team with the help of artificial intelligence; prices and charts come from real market data. Explains charts, indicators and trading strategies: how they work, where they fail and how to test them first.
Was this article helpful?
Be the first to rate it.
Comments
- No comments yet. Be the first to comment.
Ready to put it into practice?
Open your account and practice on the demo account with US$10,000 in virtual funds, without risking money.
- Secure platformProtected login and identity verification
- Multilingual supportHelp available every day
- Free demo accountUS$10,000 virtual to practice
Trading involves the risk of losing the capital invested.
