

 Português pt
 Español es
 العربية ar
 বাংলা bn
 Deutsch de
 Filipino fil
 Français fr
 हिन्दी hi
 Bahasa Indonesia id
 Italiano it
 Русский ru
 Svenska sv
 ไทย th
 Türkçe tr
 Tiếng Việt vi
 简体中文 zh
Updated:
IndicatorsAlligator and Fractals: How to Combine the Two Indicators in Practice
 Naomi TanakaEditorial character · Analysis Desk

Quick answer
Bill Williams's Alligator uses three smoothed, shifted moving averages (13, 8, and 5 periods) to show whether there's a trend; fractals mark local highs and lows across five candles. In the classic combination, the Alligator sets the direction and the break of a fractal in the same direction serves as the trigger, with a stop at the opposite fractal.
The Alligator and the fractals were created by the same author, trader Bill Williams, and were designed to work together. The Alligator tells you whether a trend exists and which way it points; the fractals mark the points where price made local highs and lows, which serve as entry triggers and stop references.
To show the combination with real numbers, we use daily quotes for gold (the GC=F futures contract, in dollars per ounce) between April and October 2026, a period in which the metal fell from $4,813.10 to $4,140.70, with clear trending and indecisive phases.
What the Alligator indicator is
The Alligator is made up of three smoothed moving averages (SMMA type, the same Wilder smoothing used in the RSI), calculated on each candle's median price, (high + low) ÷ 2, and shifted forward on the chart:
- Jaw (blue): 13-period average, shifted forward 8 candles.
- Teeth (red): 8-period average, shifted forward 5 candles.
- Lips (green): 5-period average, shifted forward 3 candles.
The metaphor is an alligator. When the three lines are tangled together, the alligator is "sleeping": the market has no direction. When they fan out, with the lips in front, then the teeth, then the jaw, the alligator is "eating": there's a trend. In an uptrend, the order from top to bottom is lips, teeth, jaw; in a downtrend, the reverse.

What fractals are
An up fractal (a high) is a candle whose high is greater than the highs of the two candles before it and the two after it. A down fractal (a low) is the mirror image: its low is lower than those of the two candles on each side. Since it depends on two later candles, a fractal is only confirmed two periods after it forms.
How to calculate the Alligator
Each line's first average is a simple average of the median prices. From there on, every new value is: (previous value × (N − 1) + today's median price) ÷ N. For the teeth, for example, N = 8: yesterday's average carries 7/8 of the weight and today's price, 1/8. The result is then plotted 5 candles ahead. That shift is what makes the Alligator react slowly and filter out much of the short-term noise.
In practice, the platform does the math. What matters is the consequence: the slower, shifted lines confirm the trend late, and price is usually far from them by the time the trend is already mature.

Real example: Alligator and fractals in gold in 2026
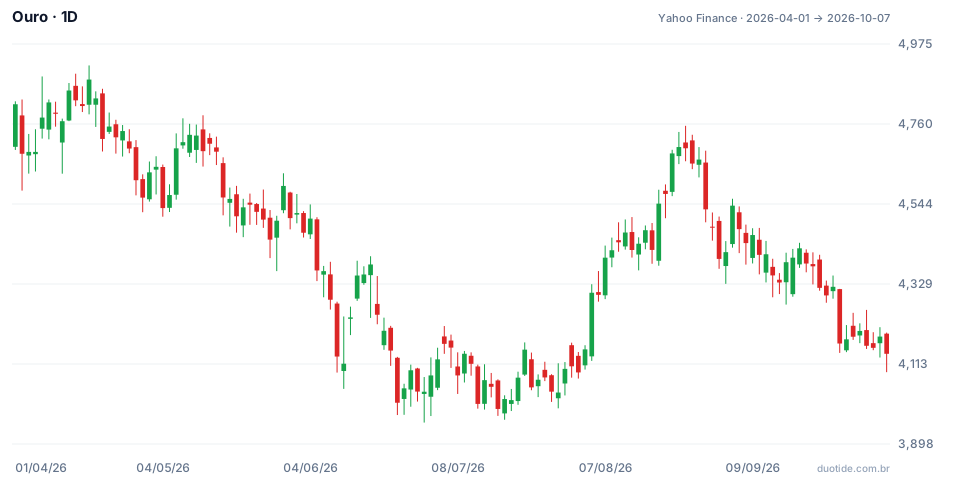
The chart shows gold's daily candles. We calculated the Alligator and the fractals on the same quotes; the numbers below come from that calculation. The period's high was $4,917.70, on April 17, and the low, $3,955.40, on June 30.
May to July: the alligator opens its mouth downward
On May 20, with gold closing at $4,535.30, the three lines lined up for a downtrend: lips at 4,668.20, teeth at 4,687.40, and jaw at 4,700.50. That alignment lasted until August 5. The May 28 down fractal, with a low of $4,363.50, was broken on June 5. A sell on that break, with a stop above the last up fractal (May 29, high of $4,627.10), would carry a risk of 4,627.10 − 4,363.50 = $263.60 per ounce. By the June 30 low, price had moved 4,363.50 − 3,955.40 = $408.10 in its favor, or about 1.5 times the risk. No one sells exactly at the low, but the example shows the logic of the risk-reward relationship.
August: a turn to the upside
On August 13 the Alligator lined up for an uptrend, with gold at $4,420.40 (lips at 4,243.10, teeth at 4,133.60, jaw at 4,107.90). That day's up fractal, with a high of $4,509.10, was broken on August 19, closing at $4,545.30. The move reached up to the August 25 up fractal, at $4,755.00, and by September 8 the lines were already tangled again. The up phase was much shorter than the down one.
September and October: a new downtrend
On September 22 the lines lined up for a downtrend again, with gold at $4,376.40. The September 16 down fractal ($4,273.30) was broken on September 28, closing at $4,168.40, and gold ended October 7 at $4,140.70.
How to use the Alligator with fractals
Direction filter
Bill Williams's classic rule: only consider up fractals (long entries) when the fractal sits above the Alligator's teeth, and down fractals (short entries) when it sits below the teeth. Fractals on the wrong side of the red line are ignored.
Entry trigger
The order sits pending a bit beyond the fractal: buy above the up fractal's high, sell below the down fractal's low. If price doesn't break through, there's no trade.
Stop and exit
The stop is usually placed at the most recent opposite fractal or on the other side of the teeth. Many traders trail the stop to each new fractal in their favor, or exit when price closes on the other side of the lips.
Limitations
The Alligator is slow by design: the turns show up days after the top or the bottom. In a sideways market, the lines cross back and forth constantly and fractals appear on both sides, generating entries that go nowhere. And since a fractal needs two later candles, the signal always arrives at least two periods late.
Common mistakes with the Alligator and fractals
- Trading fractals while the Alligator is tangled, when the indicator itself says there's no trend.
- Counting a fractal before the two following candles have closed.
- Ignoring the teeth filter and buying up fractals below the red line.
- Expecting the Alligator to nail the top or the bottom: it confirms a trend, it doesn't anticipate a reversal.
- Trading without a defined stop at the opposite fractal.
- Treating the gold example as a promise: it describes what happened, not what will happen.
To practice, open an asset's daily chart on a demo account, add the Alligator and the fractals with the default settings, and log every fractal break that passes the teeth filter: date, entry, stop, and how far price moved in its favor before hitting the stop. That record shows whether the combination works for the asset and timeframe you trade.
Practice before you risk. Open your Duotide account and test your ideas on the demo account with US$10,000 in virtual funds.
Create free accountUpdated:
Editorial character of the Duotide newsroom. Articles are written by the team with the help of artificial intelligence; prices and charts come from real market data. Explains charts, indicators and trading strategies: how they work, where they fail and how to test them first.
Was this article helpful?
Be the first to rate it.
Comments
- No comments yet. Be the first to comment.
Ready to put it into practice?
Open your account and practice on the demo account with US$10,000 in virtual funds, without risking money.
- Secure platformProtected login and identity verification
- Multilingual supportHelp available every day
- Free demo accountUS$10,000 virtual to practice
Trading involves the risk of losing the capital invested.
