

 Português pt
 Español es
 العربية ar
 বাংলা bn
 Deutsch de
 Filipino fil
 Français fr
 हिन्दी hi
 Bahasa Indonesia id
 Italiano it
 Русский ru
 Svenska sv
 ไทย th
 Türkçe tr
 Tiếng Việt vi
 简体中文 zh
Updated:
IndicatorsAwesome Oscillator: What It Is, How to Calculate It, and 3 Techniques
 Naomi TanakaEditorial character · Analysis Desk

Quick answer
The Awesome Oscillator (AO), created by Bill Williams, is the difference between the 5-period and the 34-period simple average of each candle's median price. Positive values indicate bullish momentum; negative ones, bearish. The three classic techniques are the zero-line cross, the saucer, and twin peaks, and none of them works without confirmation from price.
The Awesome Oscillator, or AO, is another creation of Bill Williams, the same author behind the Alligator and the fractals. It appears as a histogram of green and red bars below the chart and tries to answer a simple question: is the momentum of the last few days stronger or weaker than that of the last few weeks?
To move past theory, we use real daily quotes for ethereum (ETH/USDT on Binance) from April to October 2026. Over that period ETH went from $2,140.35 and closed at $2,574.14, with a low of $1,505.68 on June 6 and a high of $2,807.34 on September 21.
What the Awesome Oscillator is
The AO is the difference between two simple moving averages of each candle's median price, (high + low) ÷ 2: a short one, of 5 periods, and a long one, of 34 periods. When the short average is above the long one, the AO turns positive: recent momentum is bullish. When it's below, the AO turns negative.
The bars' color doesn't indicate the price going up or down, but the change in the AO itself: a green bar when the value is higher than the previous bar's, red when it's lower. That detail is the basis for two of the three classic techniques.

How to calculate the Awesome Oscillator
The formula is: AO = 5-period simple average of the median price − 34-period simple average of the median price.
Example with real ethereum data
The median prices of the period's last five days were:
- Oct 3: (2,690.00 + 2,665.67) ÷ 2 = 2,677.84
- Oct 4: (2,739.50 + 2,686.54) ÷ 2 = 2,713.02
- Oct 5: (2,738.00 + 2,679.63) ÷ 2 = 2,708.82
- Oct 6: (2,725.13 + 2,683.73) ÷ 2 = 2,704.43
- Oct 7: (2,699.80 + 2,538.06) ÷ 2 = 2,618.93
The sum is 13,423.04; divided by 5, that's 2,684.61. The average of the 34 median prices through October 7 was 2,599.18. The AO for October 7 is, therefore, 2,684.61 − 2,599.18 = 85.4: positive, but well below the period's peak.
Real example: ethereum's AO in 2026
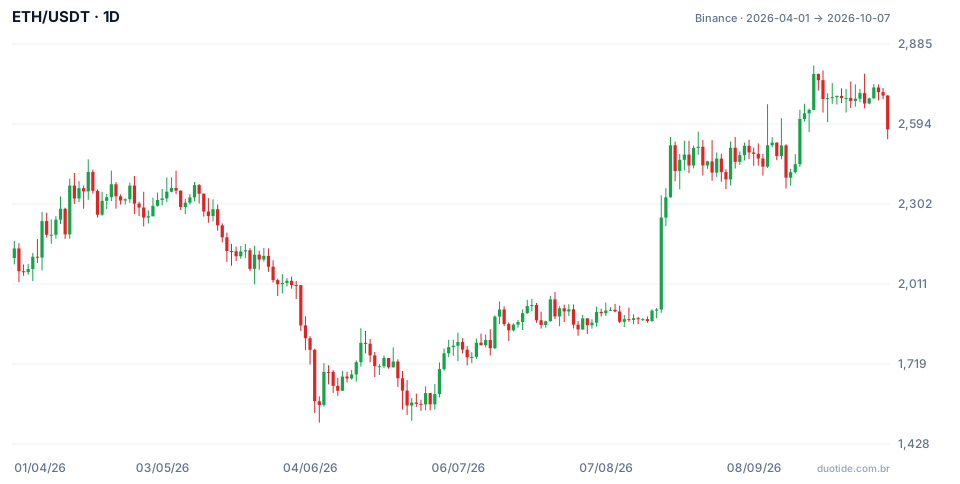
The chart shows ETH's daily candles; the AO values cited below were calculated on those same quotes. The period's highest value was 459.6, on August 25, and the lowest, −416.7, on June 9.
July: a zero-line cross that worked
On July 5 the AO went from negative to positive with ETH at $1,785.65. Ten days later, the price was at $1,917.86, up 7.4%. The momentum turn coincided with the exit from June's lows.
August: a zero-line cross that failed
On August 15 the AO crossed below zero with ETH at $1,882.64. Anyone selling on that signal would have seen the opposite: ten days later the price was at $2,442.64, up 29.8%. Four days after the cross below, on August 19, the AO had already climbed back above zero. In fast moves, the zero-line cross arrives late and can flip within a few days.
September: twin peaks to the downside (divergence)
On August 25 the AO marked 459.6 with ETH closing at $2,442.64. On September 21 the price made the period's high, $2,807.34, and closed at $2,776.19, but the AO was at only 119.9. Price at a higher high with the AO at a lower peak is the divergence Bill Williams called twin peaks. From September 21 to October 7, ETH fell from $2,776.19 to $2,574.14, a 7.3% pullback.

How to use the Awesome Oscillator: the 3 techniques
1. Zero-line cross
The AO going from negative to positive indicates the short average overtook the long one: bullish momentum. The opposite indicates bearish momentum. It's the simplest reading, and the most delayed, as the August 15 case showed.
2. Saucer
With the AO above zero, two red bars in a row appear (momentum fading), then a green one (picking back up). To the downside, with the AO negative, two green bars followed by a red one. The idea is to enter in the trend's favor after a short pause. On May 27, for example, a bearish saucer formed with ETH at $2,024.84; ten days later the price was at $1,569.69, down 22.5%. But the saucer fails too: the bullish one on September 29, with ETH at $2,677.98, was followed by a 3.9% drop through October 7.
3. Twin peaks
Two AO peaks on the same side of zero, the second smaller than the first, while the price goes further. It's a sign momentum is fading, as in September. It works better as a warning to protect profit than as a standalone signal for a counter-trend entry.
Limitations
The AO depends on two simple averages and, because of that, always reacts after the price. It has no fixed scale: an AO of 85 on ETH doesn't compare to an AO of 85 on another asset. In a sideways market, zero-line crosses and saucers multiply and most lead nowhere.
Common mistakes when using the Awesome Oscillator
- Confusing the bar's color with the price's direction: green means the AO is higher than the previous bar, not that price is rising.
- Trading every zero-line cross without looking at the bigger trend.
- Calling any pair of peaks twin peaks, without requiring they sit on the same side of zero.
- Comparing AO values between different assets or timeframes.
- Trading the AO with no stop, counting on the signal to work.
- Forgetting that the ethereum examples describe what happened, not what will happen.
To practice, add the Awesome Oscillator to an asset's daily chart on a demo account and log, over a few weeks, every zero-line cross, every saucer, and every pair of twin peaks, along with that day's price and the price ten periods later. In no time you'll have your own win rate for each technique.
Practice before you risk. Open your Duotide account and test your ideas on the demo account with US$10,000 in virtual funds.
Create free accountUpdated:
Editorial character of the Duotide newsroom. Articles are written by the team with the help of artificial intelligence; prices and charts come from real market data. Explains charts, indicators and trading strategies: how they work, where they fail and how to test them first.
Was this article helpful?
Be the first to rate it.
Comments
- No comments yet. Be the first to comment.
Ready to put it into practice?
Open your account and practice on the demo account with US$10,000 in virtual funds, without risking money.
- Secure platformProtected login and identity verification
- Multilingual supportHelp available every day
- Free demo accountUS$10,000 virtual to practice
Trading involves the risk of losing the capital invested.
